Immigrants from Uzbekistan vs Immigrants from Kuwait Single Mother Households
COMPARE
Immigrants from Uzbekistan
Immigrants from Kuwait
Single Mother Households
Single Mother Households Comparison
Immigrants from Uzbekistan
Immigrants from Kuwait
5.9%
SINGLE MOTHER HOUSEHOLDS
93.4/ 100
METRIC RATING
123rd/ 347
METRIC RANK
5.8%
SINGLE MOTHER HOUSEHOLDS
95.4/ 100
METRIC RATING
112th/ 347
METRIC RANK
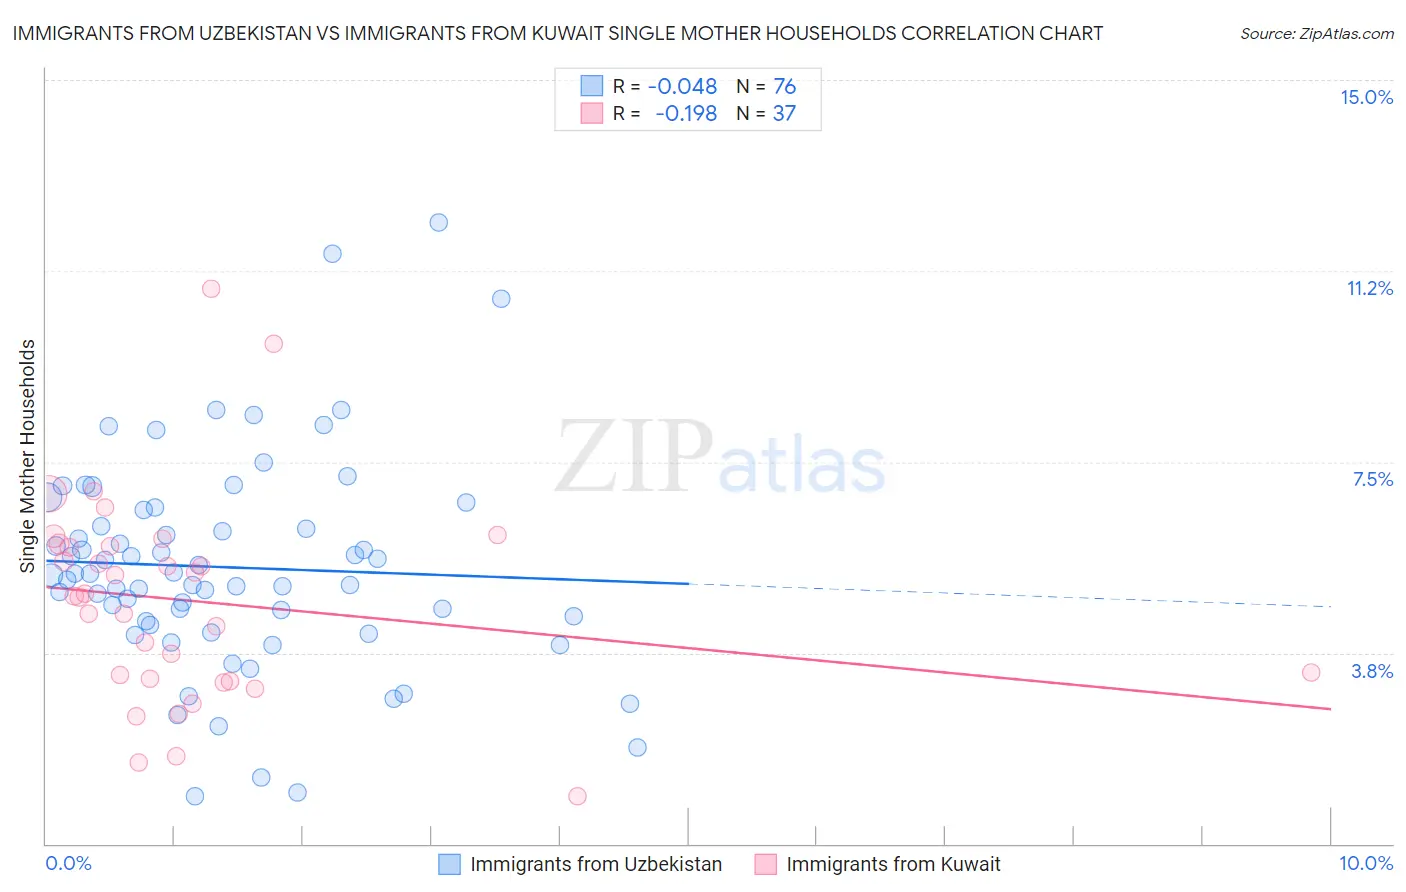
Immigrants from Uzbekistan vs Immigrants from Kuwait Single Mother Households Correlation Chart
The statistical analysis conducted on geographies consisting of 118,578,546 people shows no correlation between the proportion of Immigrants from Uzbekistan and percentage of single mother households in the United States with a correlation coefficient (R) of -0.048 and weighted average of 5.9%. Similarly, the statistical analysis conducted on geographies consisting of 136,852,016 people shows a poor negative correlation between the proportion of Immigrants from Kuwait and percentage of single mother households in the United States with a correlation coefficient (R) of -0.198 and weighted average of 5.8%, a difference of 1.2%.
Single Mother Households Correlation Summary
| Measurement | Immigrants from Uzbekistan | Immigrants from Kuwait |
| Minimum | 0.94% | 0.94% |
| Maximum | 12.2% | 10.9% |
| Range | 11.3% | 10.0% |
| Mean | 5.4% | 4.8% |
| Median | 5.3% | 4.9% |
| Interquartile 25% (IQ1) | 4.3% | 3.2% |
| Interquartile 75% (IQ3) | 6.4% | 5.9% |
| Interquartile Range (IQR) | 2.1% | 2.6% |
| Standard Deviation (Sample) | 2.1% | 2.1% |
| Standard Deviation (Population) | 2.1% | 2.0% |
Demographics Similar to Immigrants from Uzbekistan and Immigrants from Kuwait by Single Mother Households
In terms of single mother households, the demographic groups most similar to Immigrants from Uzbekistan are Belgian (5.8%, a difference of 0.060%), Immigrants from Argentina (5.9%, a difference of 0.070%), Argentinean (5.8%, a difference of 0.14%), Tongan (5.8%, a difference of 0.17%), and Slavic (5.9%, a difference of 0.23%). Similarly, the demographic groups most similar to Immigrants from Kuwait are Immigrants from England (5.8%, a difference of 0.040%), British (5.8%, a difference of 0.070%), Mongolian (5.8%, a difference of 0.070%), Immigrants from Western Europe (5.8%, a difference of 0.16%), and Dutch (5.8%, a difference of 0.20%).
| Demographics | Rating | Rank | Single Mother Households |
| Paraguayans | 95.8 /100 | #107 | Exceptional 5.8% |
| Immigrants | Italy | 95.8 /100 | #108 | Exceptional 5.8% |
| Immigrants | Western Europe | 95.7 /100 | #109 | Exceptional 5.8% |
| British | 95.5 /100 | #110 | Exceptional 5.8% |
| Immigrants | England | 95.5 /100 | #111 | Exceptional 5.8% |
| Immigrants | Kuwait | 95.4 /100 | #112 | Exceptional 5.8% |
| Mongolians | 95.3 /100 | #113 | Exceptional 5.8% |
| Dutch | 95.1 /100 | #114 | Exceptional 5.8% |
| Irish | 94.8 /100 | #115 | Exceptional 5.8% |
| Pennsylvania Germans | 94.7 /100 | #116 | Exceptional 5.8% |
| Bolivians | 94.6 /100 | #117 | Exceptional 5.8% |
| Laotians | 94.3 /100 | #118 | Exceptional 5.8% |
| South Africans | 94.1 /100 | #119 | Exceptional 5.8% |
| Tongans | 93.7 /100 | #120 | Exceptional 5.8% |
| Argentineans | 93.7 /100 | #121 | Exceptional 5.8% |
| Belgians | 93.5 /100 | #122 | Exceptional 5.8% |
| Immigrants | Uzbekistan | 93.4 /100 | #123 | Exceptional 5.9% |
| Immigrants | Argentina | 93.2 /100 | #124 | Exceptional 5.9% |
| Slavs | 92.9 /100 | #125 | Exceptional 5.9% |
| Welsh | 92.8 /100 | #126 | Exceptional 5.9% |
| Lebanese | 92.4 /100 | #127 | Exceptional 5.9% |