Peruvian vs Immigrants from Kuwait Single Mother Households
COMPARE
Peruvian
Immigrants from Kuwait
Single Mother Households
Single Mother Households Comparison
Peruvians
Immigrants from Kuwait
6.5%
SINGLE MOTHER HOUSEHOLDS
21.6/ 100
METRIC RATING
190th/ 347
METRIC RANK
5.8%
SINGLE MOTHER HOUSEHOLDS
95.4/ 100
METRIC RATING
112th/ 347
METRIC RANK
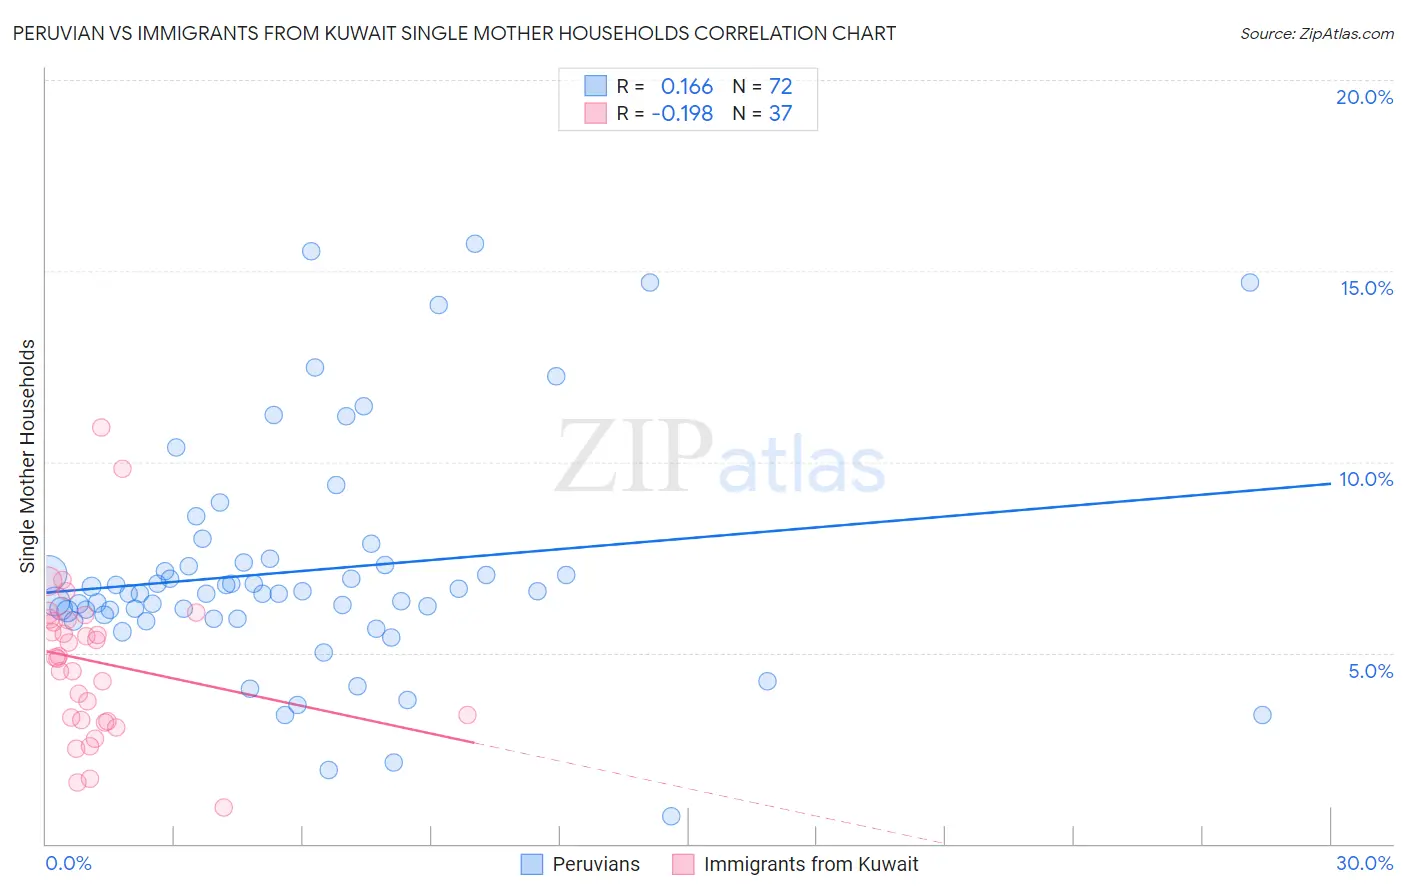
Peruvian vs Immigrants from Kuwait Single Mother Households Correlation Chart
The statistical analysis conducted on geographies consisting of 362,313,446 people shows a poor positive correlation between the proportion of Peruvians and percentage of single mother households in the United States with a correlation coefficient (R) of 0.166 and weighted average of 6.5%. Similarly, the statistical analysis conducted on geographies consisting of 136,852,016 people shows a poor negative correlation between the proportion of Immigrants from Kuwait and percentage of single mother households in the United States with a correlation coefficient (R) of -0.198 and weighted average of 5.8%, a difference of 12.9%.
Single Mother Households Correlation Summary
| Measurement | Peruvian | Immigrants from Kuwait |
| Minimum | 0.73% | 0.94% |
| Maximum | 15.7% | 10.9% |
| Range | 15.0% | 10.0% |
| Mean | 7.1% | 4.8% |
| Median | 6.6% | 4.9% |
| Interquartile 25% (IQ1) | 5.9% | 3.2% |
| Interquartile 75% (IQ3) | 7.3% | 5.9% |
| Interquartile Range (IQR) | 1.4% | 2.6% |
| Standard Deviation (Sample) | 3.0% | 2.1% |
| Standard Deviation (Population) | 3.0% | 2.0% |
Similar Demographics by Single Mother Households
Demographics Similar to Peruvians by Single Mother Households
In terms of single mother households, the demographic groups most similar to Peruvians are Samoan (6.5%, a difference of 0.060%), Delaware (6.5%, a difference of 0.26%), Ottawa (6.5%, a difference of 0.33%), American (6.6%, a difference of 0.43%), and Immigrants from Afghanistan (6.5%, a difference of 0.46%).
| Demographics | Rating | Rank | Single Mother Households |
| Spaniards | 27.8 /100 | #183 | Fair 6.5% |
| Ethiopians | 26.0 /100 | #184 | Fair 6.5% |
| Ugandans | 25.6 /100 | #185 | Fair 6.5% |
| Costa Ricans | 24.8 /100 | #186 | Fair 6.5% |
| Immigrants | Afghanistan | 24.7 /100 | #187 | Fair 6.5% |
| Ottawa | 23.8 /100 | #188 | Fair 6.5% |
| Delaware | 23.3 /100 | #189 | Fair 6.5% |
| Peruvians | 21.6 /100 | #190 | Fair 6.5% |
| Samoans | 21.2 /100 | #191 | Fair 6.5% |
| Americans | 19.0 /100 | #192 | Poor 6.6% |
| Colombians | 18.3 /100 | #193 | Poor 6.6% |
| Immigrants | Uganda | 18.3 /100 | #194 | Poor 6.6% |
| South Americans | 18.0 /100 | #195 | Poor 6.6% |
| Uruguayans | 18.0 /100 | #196 | Poor 6.6% |
| Moroccans | 17.4 /100 | #197 | Poor 6.6% |
Demographics Similar to Immigrants from Kuwait by Single Mother Households
In terms of single mother households, the demographic groups most similar to Immigrants from Kuwait are Immigrants from England (5.8%, a difference of 0.040%), British (5.8%, a difference of 0.070%), Mongolian (5.8%, a difference of 0.070%), Immigrants from Western Europe (5.8%, a difference of 0.16%), and Dutch (5.8%, a difference of 0.20%).
| Demographics | Rating | Rank | Single Mother Households |
| Taiwanese | 96.1 /100 | #105 | Exceptional 5.8% |
| Immigrants | Ukraine | 95.9 /100 | #106 | Exceptional 5.8% |
| Paraguayans | 95.8 /100 | #107 | Exceptional 5.8% |
| Immigrants | Italy | 95.8 /100 | #108 | Exceptional 5.8% |
| Immigrants | Western Europe | 95.7 /100 | #109 | Exceptional 5.8% |
| British | 95.5 /100 | #110 | Exceptional 5.8% |
| Immigrants | England | 95.5 /100 | #111 | Exceptional 5.8% |
| Immigrants | Kuwait | 95.4 /100 | #112 | Exceptional 5.8% |
| Mongolians | 95.3 /100 | #113 | Exceptional 5.8% |
| Dutch | 95.1 /100 | #114 | Exceptional 5.8% |
| Irish | 94.8 /100 | #115 | Exceptional 5.8% |
| Pennsylvania Germans | 94.7 /100 | #116 | Exceptional 5.8% |
| Bolivians | 94.6 /100 | #117 | Exceptional 5.8% |
| Laotians | 94.3 /100 | #118 | Exceptional 5.8% |
| South Africans | 94.1 /100 | #119 | Exceptional 5.8% |