Sierra Leonean vs Comanche Family Households
COMPARE
Sierra Leonean
Comanche
Family Households
Family Households Comparison
Sierra Leoneans
Comanche
63.9%
FAMILY HOUSEHOLDS
11.2/ 100
METRIC RATING
209th/ 347
METRIC RANK
63.5%
FAMILY HOUSEHOLDS
2.1/ 100
METRIC RATING
237th/ 347
METRIC RANK
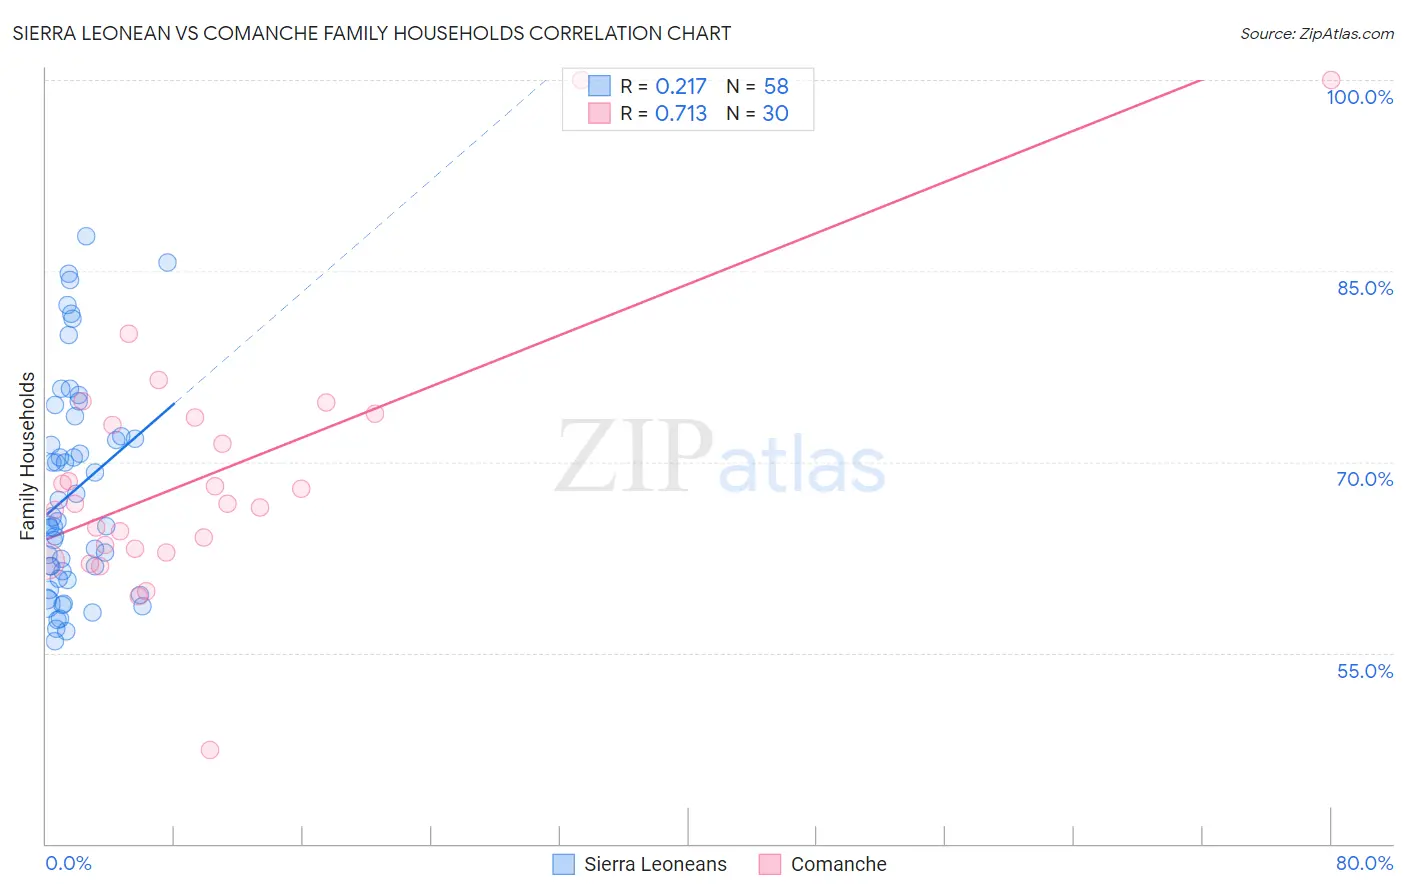
Sierra Leonean vs Comanche Family Households Correlation Chart
The statistical analysis conducted on geographies consisting of 83,352,562 people shows a weak positive correlation between the proportion of Sierra Leoneans and percentage of family households in the United States with a correlation coefficient (R) of 0.217 and weighted average of 63.9%. Similarly, the statistical analysis conducted on geographies consisting of 109,767,909 people shows a strong positive correlation between the proportion of Comanche and percentage of family households in the United States with a correlation coefficient (R) of 0.713 and weighted average of 63.5%, a difference of 0.61%.
Family Households Correlation Summary
| Measurement | Sierra Leonean | Comanche |
| Minimum | 55.9% | 47.4% |
| Maximum | 87.8% | 100.0% |
| Range | 31.8% | 52.6% |
| Mean | 67.7% | 69.1% |
| Median | 65.2% | 66.7% |
| Interquartile 25% (IQ1) | 60.8% | 63.2% |
| Interquartile 75% (IQ3) | 72.0% | 73.4% |
| Interquartile Range (IQR) | 11.2% | 10.3% |
| Standard Deviation (Sample) | 8.4% | 10.5% |
| Standard Deviation (Population) | 8.4% | 10.3% |
Similar Demographics by Family Households
Demographics Similar to Sierra Leoneans by Family Households
In terms of family households, the demographic groups most similar to Sierra Leoneans are Nigerian (63.9%, a difference of 0.010%), Immigrants from Bangladesh (63.9%, a difference of 0.010%), Immigrants from Lithuania (63.9%, a difference of 0.030%), Brazilian (63.9%, a difference of 0.040%), and Immigrants from Uruguay (63.9%, a difference of 0.050%).
| Demographics | Rating | Rank | Family Households |
| Iranians | 13.5 /100 | #202 | Poor 63.9% |
| Norwegians | 13.2 /100 | #203 | Poor 63.9% |
| Immigrants | Uruguay | 12.8 /100 | #204 | Poor 63.9% |
| Brazilians | 12.4 /100 | #205 | Poor 63.9% |
| Immigrants | Lithuania | 12.1 /100 | #206 | Poor 63.9% |
| Nigerians | 11.5 /100 | #207 | Poor 63.9% |
| Immigrants | Bangladesh | 11.4 /100 | #208 | Poor 63.9% |
| Sierra Leoneans | 11.2 /100 | #209 | Poor 63.9% |
| Immigrants | Thailand | 9.6 /100 | #210 | Tragic 63.8% |
| Shoshone | 9.4 /100 | #211 | Tragic 63.8% |
| Immigrants | Netherlands | 9.4 /100 | #212 | Tragic 63.8% |
| Immigrants | Northern Europe | 8.8 /100 | #213 | Tragic 63.8% |
| Celtics | 8.0 /100 | #214 | Tragic 63.8% |
| Belgians | 7.6 /100 | #215 | Tragic 63.8% |
| Croatians | 7.3 /100 | #216 | Tragic 63.8% |
Demographics Similar to Comanche by Family Households
In terms of family households, the demographic groups most similar to Comanche are Ghanaian (63.5%, a difference of 0.0%), Immigrants from Zimbabwe (63.5%, a difference of 0.010%), Albanian (63.5%, a difference of 0.020%), Aleut (63.4%, a difference of 0.030%), and South African (63.4%, a difference of 0.030%).
| Demographics | Rating | Rank | Family Households |
| Immigrants | Brazil | 3.0 /100 | #230 | Tragic 63.6% |
| Immigrants | Greece | 2.9 /100 | #231 | Tragic 63.5% |
| Immigrants | Northern Africa | 2.6 /100 | #232 | Tragic 63.5% |
| Immigrants | Armenia | 2.6 /100 | #233 | Tragic 63.5% |
| Finns | 2.3 /100 | #234 | Tragic 63.5% |
| Albanians | 2.2 /100 | #235 | Tragic 63.5% |
| Ghanaians | 2.1 /100 | #236 | Tragic 63.5% |
| Comanche | 2.1 /100 | #237 | Tragic 63.5% |
| Immigrants | Zimbabwe | 2.0 /100 | #238 | Tragic 63.5% |
| Aleuts | 1.9 /100 | #239 | Tragic 63.4% |
| South Africans | 1.9 /100 | #240 | Tragic 63.4% |
| Immigrants | St. Vincent and the Grenadines | 1.9 /100 | #241 | Tragic 63.4% |
| Immigrants | Israel | 1.8 /100 | #242 | Tragic 63.4% |
| Immigrants | Czechoslovakia | 1.8 /100 | #243 | Tragic 63.4% |
| Eastern Europeans | 1.6 /100 | #244 | Tragic 63.4% |