Pima vs Comanche Single Father Households
COMPARE
Pima
Comanche
Single Father Households
Single Father Households Comparison
Pima
Comanche
4.2%
SINGLE FATHER HOUSEHOLDS
0.0/ 100
METRIC RATING
343rd/ 347
METRIC RANK
2.5%
SINGLE FATHER HOUSEHOLDS
1.0/ 100
METRIC RATING
259th/ 347
METRIC RANK
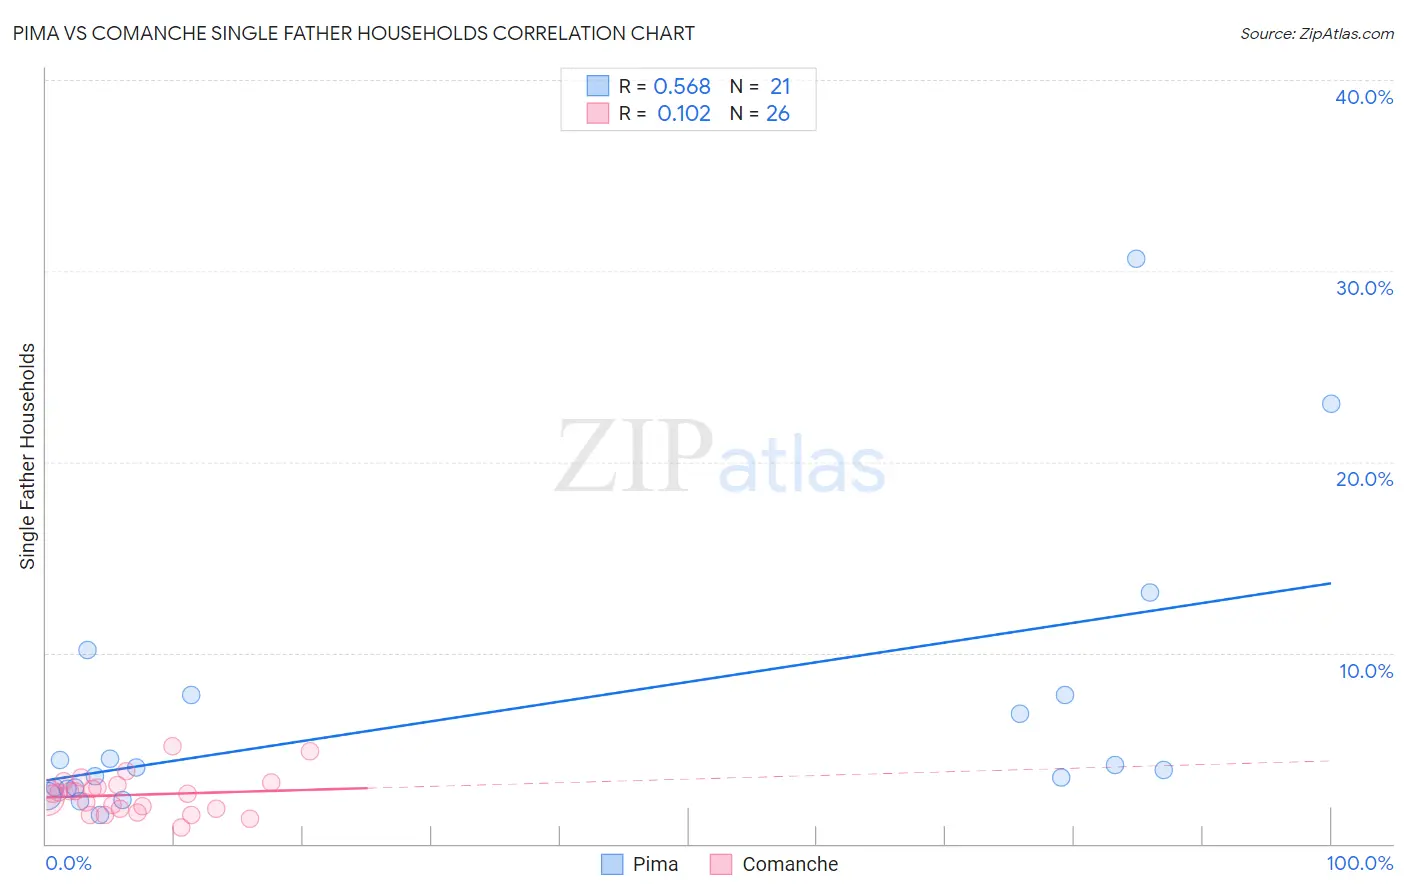
Pima vs Comanche Single Father Households Correlation Chart
The statistical analysis conducted on geographies consisting of 61,336,251 people shows a substantial positive correlation between the proportion of Pima and percentage of single father households in the United States with a correlation coefficient (R) of 0.568 and weighted average of 4.2%. Similarly, the statistical analysis conducted on geographies consisting of 109,445,833 people shows a poor positive correlation between the proportion of Comanche and percentage of single father households in the United States with a correlation coefficient (R) of 0.102 and weighted average of 2.5%, a difference of 64.8%.
Single Father Households Correlation Summary
| Measurement | Pima | Comanche |
| Minimum | 1.5% | 0.82% |
| Maximum | 30.6% | 5.1% |
| Range | 29.1% | 4.3% |
| Mean | 6.9% | 2.6% |
| Median | 4.0% | 2.6% |
| Interquartile 25% (IQ1) | 2.9% | 1.8% |
| Interquartile 75% (IQ3) | 7.8% | 3.1% |
| Interquartile Range (IQR) | 4.9% | 1.2% |
| Standard Deviation (Sample) | 7.3% | 1.0% |
| Standard Deviation (Population) | 7.2% | 1.0% |
Similar Demographics by Single Father Households
Demographics Similar to Pima by Single Father Households
In terms of single father households, the demographic groups most similar to Pima are Yakama (4.2%, a difference of 0.24%), Menominee (4.2%, a difference of 0.93%), Tohono O'odham (3.8%, a difference of 9.2%), Inupiat (4.9%, a difference of 16.4%), and Crow (3.5%, a difference of 18.8%).
| Demographics | Rating | Rank | Single Father Households |
| Natives/Alaskans | 0.0 /100 | #333 | Tragic 3.2% |
| Yuman | 0.0 /100 | #334 | Tragic 3.3% |
| Colville | 0.0 /100 | #335 | Tragic 3.3% |
| Paiute | 0.0 /100 | #336 | Tragic 3.3% |
| Pueblo | 0.0 /100 | #337 | Tragic 3.3% |
| Sioux | 0.0 /100 | #338 | Tragic 3.3% |
| Alaskan Athabascans | 0.0 /100 | #339 | Tragic 3.4% |
| Alaska Natives | 0.0 /100 | #340 | Tragic 3.5% |
| Crow | 0.0 /100 | #341 | Tragic 3.5% |
| Tohono O'odham | 0.0 /100 | #342 | Tragic 3.8% |
| Pima | 0.0 /100 | #343 | Tragic 4.2% |
| Yakama | 0.0 /100 | #344 | Tragic 4.2% |
| Menominee | 0.0 /100 | #345 | Tragic 4.2% |
| Inupiat | 0.0 /100 | #346 | Tragic 4.9% |
| Yup'ik | 0.0 /100 | #347 | Tragic 5.4% |
Demographics Similar to Comanche by Single Father Households
In terms of single father households, the demographic groups most similar to Comanche are Immigrants from Caribbean (2.5%, a difference of 0.090%), Spanish (2.5%, a difference of 0.16%), Immigrants from Congo (2.5%, a difference of 0.24%), Immigrants from Belize (2.5%, a difference of 0.25%), and Immigrants from Liberia (2.5%, a difference of 0.40%).
| Demographics | Rating | Rank | Single Father Households |
| Immigrants | Eritrea | 2.0 /100 | #252 | Tragic 2.5% |
| Immigrants | Somalia | 1.9 /100 | #253 | Tragic 2.5% |
| Immigrants | Thailand | 1.8 /100 | #254 | Tragic 2.5% |
| Tongans | 1.5 /100 | #255 | Tragic 2.5% |
| Potawatomi | 1.4 /100 | #256 | Tragic 2.5% |
| Immigrants | Congo | 1.2 /100 | #257 | Tragic 2.5% |
| Spanish | 1.1 /100 | #258 | Tragic 2.5% |
| Comanche | 1.0 /100 | #259 | Tragic 2.5% |
| Immigrants | Caribbean | 1.0 /100 | #260 | Tragic 2.5% |
| Immigrants | Belize | 0.9 /100 | #261 | Tragic 2.5% |
| Immigrants | Liberia | 0.8 /100 | #262 | Tragic 2.5% |
| Dominicans | 0.8 /100 | #263 | Tragic 2.5% |
| Indonesians | 0.5 /100 | #264 | Tragic 2.6% |
| Immigrants | Micronesia | 0.5 /100 | #265 | Tragic 2.6% |
| French American Indians | 0.5 /100 | #266 | Tragic 2.6% |