British vs Comanche Family Households
COMPARE
British
Comanche
Family Households
Family Households Comparison
British
Comanche
64.4%
FAMILY HOUSEHOLDS
61.6/ 100
METRIC RATING
162nd/ 347
METRIC RANK
63.5%
FAMILY HOUSEHOLDS
2.1/ 100
METRIC RATING
237th/ 347
METRIC RANK
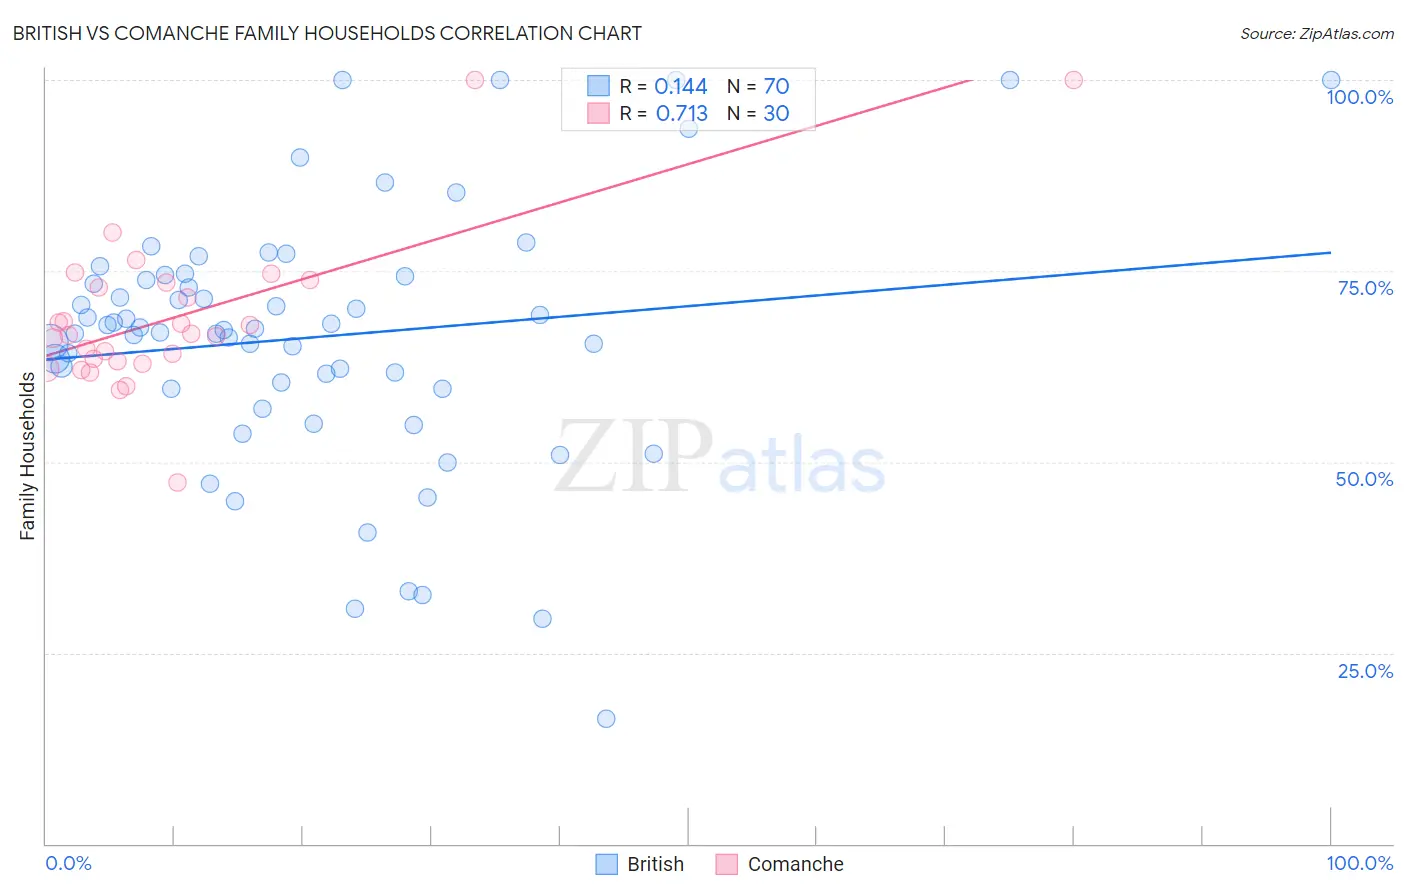
British vs Comanche Family Households Correlation Chart
The statistical analysis conducted on geographies consisting of 531,009,478 people shows a poor positive correlation between the proportion of British and percentage of family households in the United States with a correlation coefficient (R) of 0.144 and weighted average of 64.4%. Similarly, the statistical analysis conducted on geographies consisting of 109,767,909 people shows a strong positive correlation between the proportion of Comanche and percentage of family households in the United States with a correlation coefficient (R) of 0.713 and weighted average of 63.5%, a difference of 1.5%.
Family Households Correlation Summary
| Measurement | British | Comanche |
| Minimum | 16.4% | 47.4% |
| Maximum | 100.0% | 100.0% |
| Range | 83.6% | 52.6% |
| Mean | 66.4% | 69.1% |
| Median | 67.4% | 66.7% |
| Interquartile 25% (IQ1) | 59.6% | 63.2% |
| Interquartile 75% (IQ3) | 74.3% | 73.4% |
| Interquartile Range (IQR) | 14.8% | 10.3% |
| Standard Deviation (Sample) | 16.9% | 10.5% |
| Standard Deviation (Population) | 16.8% | 10.3% |
Similar Demographics by Family Households
Demographics Similar to British by Family Households
In terms of family households, the demographic groups most similar to British are Chickasaw (64.4%, a difference of 0.0%), Immigrants from England (64.4%, a difference of 0.010%), Immigrants from Nigeria (64.4%, a difference of 0.020%), Immigrants from Southern Europe (64.4%, a difference of 0.020%), and Scotch-Irish (64.4%, a difference of 0.030%).
| Demographics | Rating | Rank | Family Households |
| Uruguayans | 67.7 /100 | #155 | Good 64.5% |
| Czechs | 67.0 /100 | #156 | Good 64.5% |
| Canadians | 66.6 /100 | #157 | Good 64.4% |
| Lebanese | 66.4 /100 | #158 | Good 64.4% |
| Germans | 65.8 /100 | #159 | Good 64.4% |
| Immigrants | Moldova | 65.2 /100 | #160 | Good 64.4% |
| Immigrants | England | 62.6 /100 | #161 | Good 64.4% |
| British | 61.6 /100 | #162 | Good 64.4% |
| Chickasaw | 61.5 /100 | #163 | Good 64.4% |
| Immigrants | Nigeria | 60.1 /100 | #164 | Good 64.4% |
| Immigrants | Southern Europe | 60.0 /100 | #165 | Good 64.4% |
| Scotch-Irish | 59.2 /100 | #166 | Average 64.4% |
| Irish | 57.9 /100 | #167 | Average 64.4% |
| Hondurans | 57.5 /100 | #168 | Average 64.4% |
| Iraqis | 56.0 /100 | #169 | Average 64.4% |
Demographics Similar to Comanche by Family Households
In terms of family households, the demographic groups most similar to Comanche are Ghanaian (63.5%, a difference of 0.0%), Immigrants from Zimbabwe (63.5%, a difference of 0.010%), Albanian (63.5%, a difference of 0.020%), Aleut (63.4%, a difference of 0.030%), and South African (63.4%, a difference of 0.030%).
| Demographics | Rating | Rank | Family Households |
| Immigrants | Brazil | 3.0 /100 | #230 | Tragic 63.6% |
| Immigrants | Greece | 2.9 /100 | #231 | Tragic 63.5% |
| Immigrants | Northern Africa | 2.6 /100 | #232 | Tragic 63.5% |
| Immigrants | Armenia | 2.6 /100 | #233 | Tragic 63.5% |
| Finns | 2.3 /100 | #234 | Tragic 63.5% |
| Albanians | 2.2 /100 | #235 | Tragic 63.5% |
| Ghanaians | 2.1 /100 | #236 | Tragic 63.5% |
| Comanche | 2.1 /100 | #237 | Tragic 63.5% |
| Immigrants | Zimbabwe | 2.0 /100 | #238 | Tragic 63.5% |
| Aleuts | 1.9 /100 | #239 | Tragic 63.4% |
| South Africans | 1.9 /100 | #240 | Tragic 63.4% |
| Immigrants | St. Vincent and the Grenadines | 1.9 /100 | #241 | Tragic 63.4% |
| Immigrants | Israel | 1.8 /100 | #242 | Tragic 63.4% |
| Immigrants | Czechoslovakia | 1.8 /100 | #243 | Tragic 63.4% |
| Eastern Europeans | 1.6 /100 | #244 | Tragic 63.4% |