Peruvian vs Immigrants 9th Grade
COMPARE
Peruvian
Immigrants
9th Grade
9th Grade Comparison
Peruvians
Immigrants
93.8%
9TH GRADE
0.2/ 100
METRIC RATING
274th/ 347
METRIC RANK
92.5%
9TH GRADE
0.0/ 100
METRIC RATING
307th/ 347
METRIC RANK
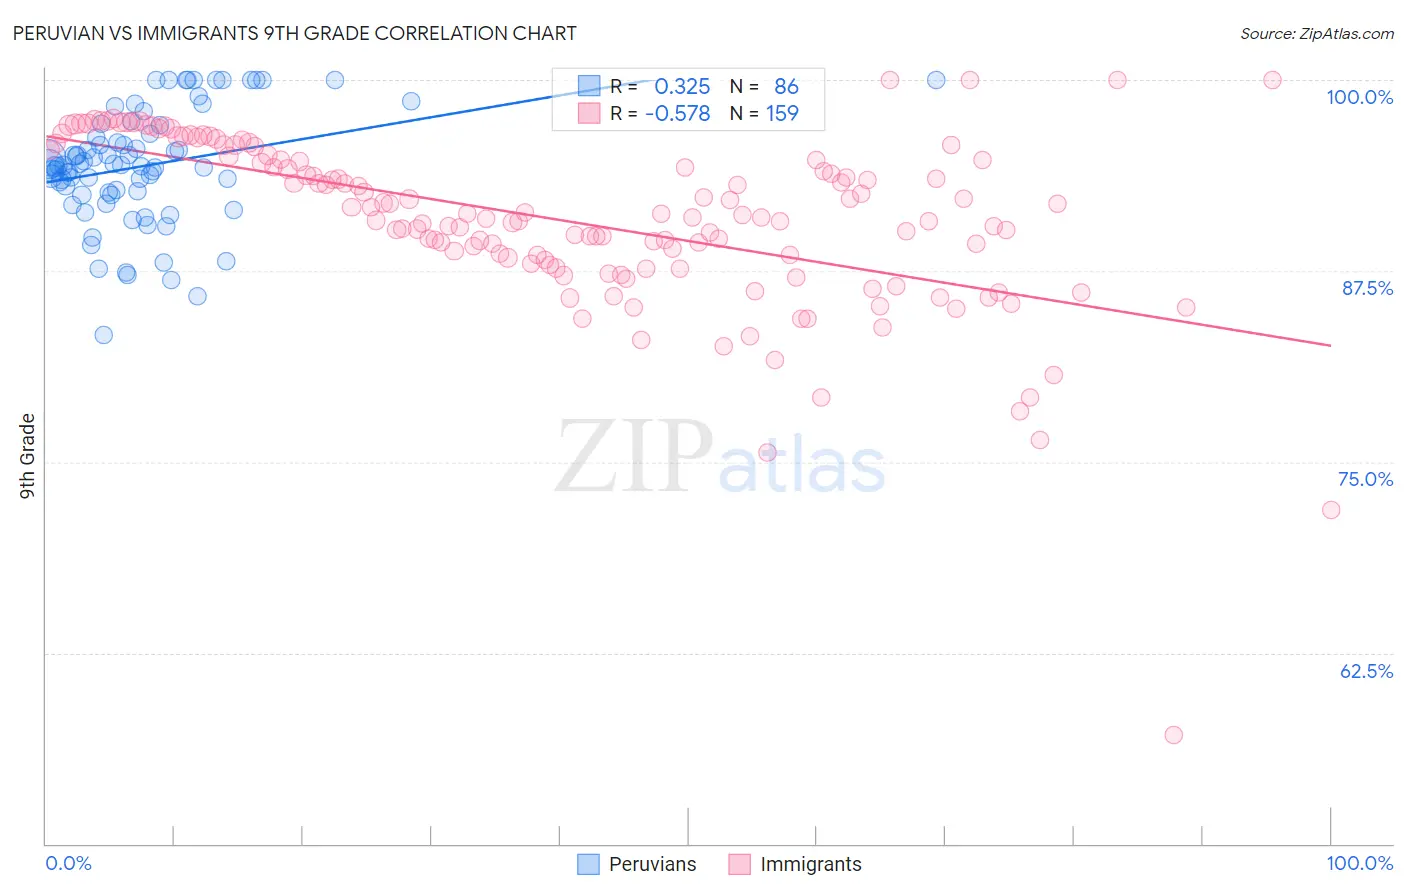
Peruvian vs Immigrants 9th Grade Correlation Chart
The statistical analysis conducted on geographies consisting of 363,251,075 people shows a mild positive correlation between the proportion of Peruvians and percentage of population with at least 9th grade education in the United States with a correlation coefficient (R) of 0.325 and weighted average of 93.8%. Similarly, the statistical analysis conducted on geographies consisting of 577,786,659 people shows a substantial negative correlation between the proportion of Immigrants and percentage of population with at least 9th grade education in the United States with a correlation coefficient (R) of -0.578 and weighted average of 92.5%, a difference of 1.3%.
9th Grade Correlation Summary
| Measurement | Peruvian | Immigrants |
| Minimum | 83.3% | 57.2% |
| Maximum | 100.0% | 100.0% |
| Range | 16.7% | 42.8% |
| Mean | 94.4% | 90.8% |
| Median | 94.4% | 91.0% |
| Interquartile 25% (IQ1) | 92.6% | 88.0% |
| Interquartile 75% (IQ3) | 96.5% | 94.8% |
| Interquartile Range (IQR) | 3.9% | 6.8% |
| Standard Deviation (Sample) | 3.7% | 5.7% |
| Standard Deviation (Population) | 3.7% | 5.7% |
Similar Demographics by 9th Grade
Demographics Similar to Peruvians by 9th Grade
In terms of 9th grade, the demographic groups most similar to Peruvians are Immigrants from South America (93.8%, a difference of 0.0%), Immigrants from Western Africa (93.8%, a difference of 0.010%), Immigrants from Colombia (93.8%, a difference of 0.010%), Immigrants from Ghana (93.8%, a difference of 0.020%), and West Indian (93.7%, a difference of 0.030%).
| Demographics | Rating | Rank | 9th Grade |
| Armenians | 0.3 /100 | #267 | Tragic 93.9% |
| Immigrants | Bolivia | 0.3 /100 | #268 | Tragic 93.9% |
| Immigrants | Uruguay | 0.2 /100 | #269 | Tragic 93.8% |
| Yuman | 0.2 /100 | #270 | Tragic 93.8% |
| Immigrants | Ghana | 0.2 /100 | #271 | Tragic 93.8% |
| Immigrants | Western Africa | 0.2 /100 | #272 | Tragic 93.8% |
| Immigrants | South America | 0.2 /100 | #273 | Tragic 93.8% |
| Peruvians | 0.2 /100 | #274 | Tragic 93.8% |
| Immigrants | Colombia | 0.2 /100 | #275 | Tragic 93.8% |
| West Indians | 0.2 /100 | #276 | Tragic 93.7% |
| Immigrants | Philippines | 0.1 /100 | #277 | Tragic 93.7% |
| Immigrants | Eritrea | 0.1 /100 | #278 | Tragic 93.7% |
| Trinidadians and Tobagonians | 0.1 /100 | #279 | Tragic 93.7% |
| Taiwanese | 0.1 /100 | #280 | Tragic 93.6% |
| Immigrants | Trinidad and Tobago | 0.1 /100 | #281 | Tragic 93.6% |
Demographics Similar to Immigrants by 9th Grade
In terms of 9th grade, the demographic groups most similar to Immigrants are Immigrants from Guyana (92.5%, a difference of 0.010%), Japanese (92.6%, a difference of 0.10%), Immigrants from Vietnam (92.6%, a difference of 0.10%), Tohono O'odham (92.6%, a difference of 0.12%), and Guyanese (92.7%, a difference of 0.14%).
| Demographics | Rating | Rank | 9th Grade |
| Yaqui | 0.0 /100 | #300 | Tragic 92.9% |
| Immigrants | Haiti | 0.0 /100 | #301 | Tragic 92.7% |
| Immigrants | Dominica | 0.0 /100 | #302 | Tragic 92.7% |
| Guyanese | 0.0 /100 | #303 | Tragic 92.7% |
| Tohono O'odham | 0.0 /100 | #304 | Tragic 92.6% |
| Japanese | 0.0 /100 | #305 | Tragic 92.6% |
| Immigrants | Vietnam | 0.0 /100 | #306 | Tragic 92.6% |
| Immigrants | Immigrants | 0.0 /100 | #307 | Tragic 92.5% |
| Immigrants | Guyana | 0.0 /100 | #308 | Tragic 92.5% |
| Immigrants | Bangladesh | 0.0 /100 | #309 | Tragic 92.4% |
| Immigrants | Cambodia | 0.0 /100 | #310 | Tragic 92.4% |
| Immigrants | Fiji | 0.0 /100 | #311 | Tragic 92.3% |
| Houma | 0.0 /100 | #312 | Tragic 92.3% |
| Vietnamese | 0.0 /100 | #313 | Tragic 92.3% |
| Immigrants | Portugal | 0.0 /100 | #314 | Tragic 92.2% |