Paraguayan vs Immigrants from Brazil Currently Married

COMPARE

Paraguayan
Race
Ancestry
AfghanAfricanAlaska NativeAlaskan AthabascanAlbanianAleutAlsatianAmericanApacheArabArapahoArgentineanArmenianAssyrian/Chaldean/SyriacAustralianAustrianBahamianBangladeshiBarbadianBasqueBelgianBelizeanBermudanBhutaneseBlackfeetBolivianBrazilianBritishBritish West IndianBulgarianBurmeseCajunCambodianCanadianCape VerdeanCarpatho RusynCelticCentral AmericanCentral American IndianCherokeeCheyenneChickasawChileanChineseChippewaChoctawColombianColvilleComancheCosta RicanCreeCreekCroatianCrowCubanCypriotCzechCzechoslovakianDanishDelawareDominicanDutchDutch West IndianEastern EuropeanEcuadorianEgyptianEnglishEstonianEthiopianEuropeanFijianFilipinoFinnishFrenchFrench American IndianFrench CanadianGermanGerman RussianGhanaianGreekGuamanian/ChamorroGuatemalanGuyaneseHaitianHmongHonduranHopiHoumaHungarianIcelanderIndian (Asian)IndonesianInupiatIranianIraqiIrishIroquoisIsraeliItalianJamaicanJapaneseJordanianKenyanKiowaKoreanLaotianLatvianLebaneseLiberianLithuanianLumbeeLuxembourgerMacedonianMalaysianMalteseMarshalleseMenomineeMexicanMexican American IndianMongolianMoroccanNative HawaiianNavajoNepaleseNew ZealanderNicaraguanNigerianNorthern EuropeanNorwegianOkinawanOsageOttawaPaiutePakistaniPalestinianPanamanianParaguayanPennsylvania GermanPeruvianPimaPolishPortuguesePotawatomiPuebloPuerto RicanPuget Sound SalishRomanianRussianSalvadoranSamoanScandinavianScotch-IrishScottishSeminoleSenegaleseSerbianShoshoneSierra LeoneanSiouxSlavicSlovakSloveneSomaliSouth AfricanSouth AmericanSouth American IndianSoviet UnionSpaniardSpanishSpanish AmericanSpanish American IndianSri LankanSubsaharan AfricanSudaneseSwedishSwissSyrianTaiwaneseThaiTlingit-HaidaTohono O'OdhamTonganTrinidadian and TobagonianTsimshianTurkishU.S. Virgin IslanderUgandanUkrainianUruguayanUteVenezuelanVietnameseWelshWest IndianYakamaYaquiYugoslavianYumanYup'ikZimbabwean
Immigration
NonimmigrantsImmigrantsAfghanistanAfricaAlbaniaArgentinaArmeniaAsiaAustraliaAustriaBahamasBangladeshBarbadosBelarusBelgiumBelizeBoliviaBosnia and HerzegovinaBulgariaBurma/MyanmarCabo VerdeCambodiaCameroonCanadaCaribbeanCentral AmericaChileChinaColombiaCongoCosta RicaCroatiaCubaCzechoslovakiaDenmarkDominicaDominican RepublicEastern AfricaEastern AsiaEastern EuropeEcuadorEgyptEl SalvadorEnglandEritreaEthiopiaEuropeFijiFranceGermanyGhanaGreeceGrenadaGuatemalaGuyanaHaitiHondurasHong KongHungaryIndiaIndonesiaIranIraqIrelandIsraelItalyJamaicaJapanJordanKazakhstanKenyaKoreaKuwaitLaosLatin AmericaLatviaLebanonLiberiaLithuaniaMalaysiaMexicoMicronesiaMiddle AfricaMoldovaMoroccoNepalNetherlandsNicaraguaNigeriaNorth AmericaNorth MacedoniaNorthern AfricaNorthern EuropeNorwayOceaniaPakistanPanamaPeruPhilippinesPolandPortugalRomaniaRussiaSaudi ArabiaScotlandSenegalSerbiaSierra LeoneSingaporeSomaliaSouth AfricaSouth AmericaSouth Central AsiaSouth Eastern AsiaSouthern EuropeSpainSri LankaSt. Vincent and the GrenadinesSudanSwedenSwitzerlandSyriaTaiwanThailandTrinidad and TobagoTurkeyUgandaUkraineUruguayUzbekistanVenezuelaVietnamWest IndiesWestern AfricaWestern AsiaWestern EuropeYemenZaireZimbabweAzores
Immigrants from Brazil
Race
Ancestry
AfghanAfricanAlaska NativeAlaskan AthabascanAlbanianAleutAlsatianAmericanApacheArabArapahoArgentineanArmenianAssyrian/Chaldean/SyriacAustralianAustrianBahamianBangladeshiBarbadianBasqueBelgianBelizeanBermudanBhutaneseBlackfeetBolivianBrazilianBritishBritish West IndianBulgarianBurmeseCajunCambodianCanadianCape VerdeanCarpatho RusynCelticCentral AmericanCentral American IndianCherokeeCheyenneChickasawChileanChineseChippewaChoctawColombianColvilleComancheCosta RicanCreeCreekCroatianCrowCubanCypriotCzechCzechoslovakianDanishDelawareDominicanDutchDutch West IndianEastern EuropeanEcuadorianEgyptianEnglishEstonianEthiopianEuropeanFijianFilipinoFinnishFrenchFrench American IndianFrench CanadianGermanGerman RussianGhanaianGreekGuamanian/ChamorroGuatemalanGuyaneseHaitianHmongHonduranHopiHoumaHungarianIcelanderIndian (Asian)IndonesianInupiatIranianIraqiIrishIroquoisIsraeliItalianJamaicanJapaneseJordanianKenyanKiowaKoreanLaotianLatvianLebaneseLiberianLithuanianLumbeeLuxembourgerMacedonianMalaysianMalteseMarshalleseMenomineeMexicanMexican American IndianMongolianMoroccanNative HawaiianNavajoNepaleseNew ZealanderNicaraguanNigerianNorthern EuropeanNorwegianOkinawanOsageOttawaPaiutePakistaniPalestinianPanamanianPennsylvania GermanPeruvianPimaPolishPortuguesePotawatomiPuebloPuerto RicanPuget Sound SalishRomanianRussianSalvadoranSamoanScandinavianScotch-IrishScottishSeminoleSenegaleseSerbianShoshoneSierra LeoneanSiouxSlavicSlovakSloveneSomaliSouth AfricanSouth AmericanSouth American IndianSoviet UnionSpaniardSpanishSpanish AmericanSpanish American IndianSri LankanSubsaharan AfricanSudaneseSwedishSwissSyrianTaiwaneseThaiTlingit-HaidaTohono O'OdhamTonganTrinidadian and TobagonianTsimshianTurkishU.S. Virgin IslanderUgandanUkrainianUruguayanUteVenezuelanVietnameseWelshWest IndianYakamaYaquiYugoslavianYumanYup'ikZimbabwean
Immigration
NonimmigrantsImmigrantsAfghanistanAfricaAlbaniaArgentinaArmeniaAsiaAustraliaAustriaBahamasBangladeshBarbadosBelarusBelgiumBelizeBoliviaBosnia and HerzegovinaBrazilBulgariaBurma/MyanmarCabo VerdeCambodiaCameroonCanadaCaribbeanCentral AmericaChileChinaColombiaCongoCosta RicaCroatiaCubaCzechoslovakiaDenmarkDominicaDominican RepublicEastern AfricaEastern AsiaEastern EuropeEcuadorEgyptEl SalvadorEnglandEritreaEthiopiaEuropeFijiFranceGermanyGhanaGreeceGrenadaGuatemalaGuyanaHaitiHondurasHong KongHungaryIndiaIndonesiaIranIraqIrelandIsraelItalyJamaicaJapanJordanKazakhstanKenyaKoreaKuwaitLaosLatin AmericaLatviaLebanonLiberiaLithuaniaMalaysiaMexicoMicronesiaMiddle AfricaMoldovaMoroccoNepalNetherlandsNicaraguaNigeriaNorth AmericaNorth MacedoniaNorthern AfricaNorthern EuropeNorwayOceaniaPakistanPanamaPeruPhilippinesPolandPortugalRomaniaRussiaSaudi ArabiaScotlandSenegalSerbiaSierra LeoneSingaporeSomaliaSouth AfricaSouth AmericaSouth Central AsiaSouth Eastern AsiaSouthern EuropeSpainSri LankaSt. Vincent and the GrenadinesSudanSwedenSwitzerlandSyriaTaiwanThailandTrinidad and TobagoTurkeyUgandaUkraineUruguayUzbekistanVenezuelaVietnamWest IndiesWestern AfricaWestern AsiaWestern EuropeYemenZaireZimbabweAzores
Currently Married
Income
Poverty
Unemployment
Labor Participation
Family Structure
Vehicle Availability
Education Level
Disability

Currently Married Comparison

Paraguayans

Immigrants from Brazil

Good
Average
47.2%
CURRENTLY MARRIED
77.8/ 100
METRIC RATING
137th/ 347
METRIC RANK
46.6%
CURRENTLY MARRIED
49.9/ 100
METRIC RATING
175th/ 347
METRIC RANK

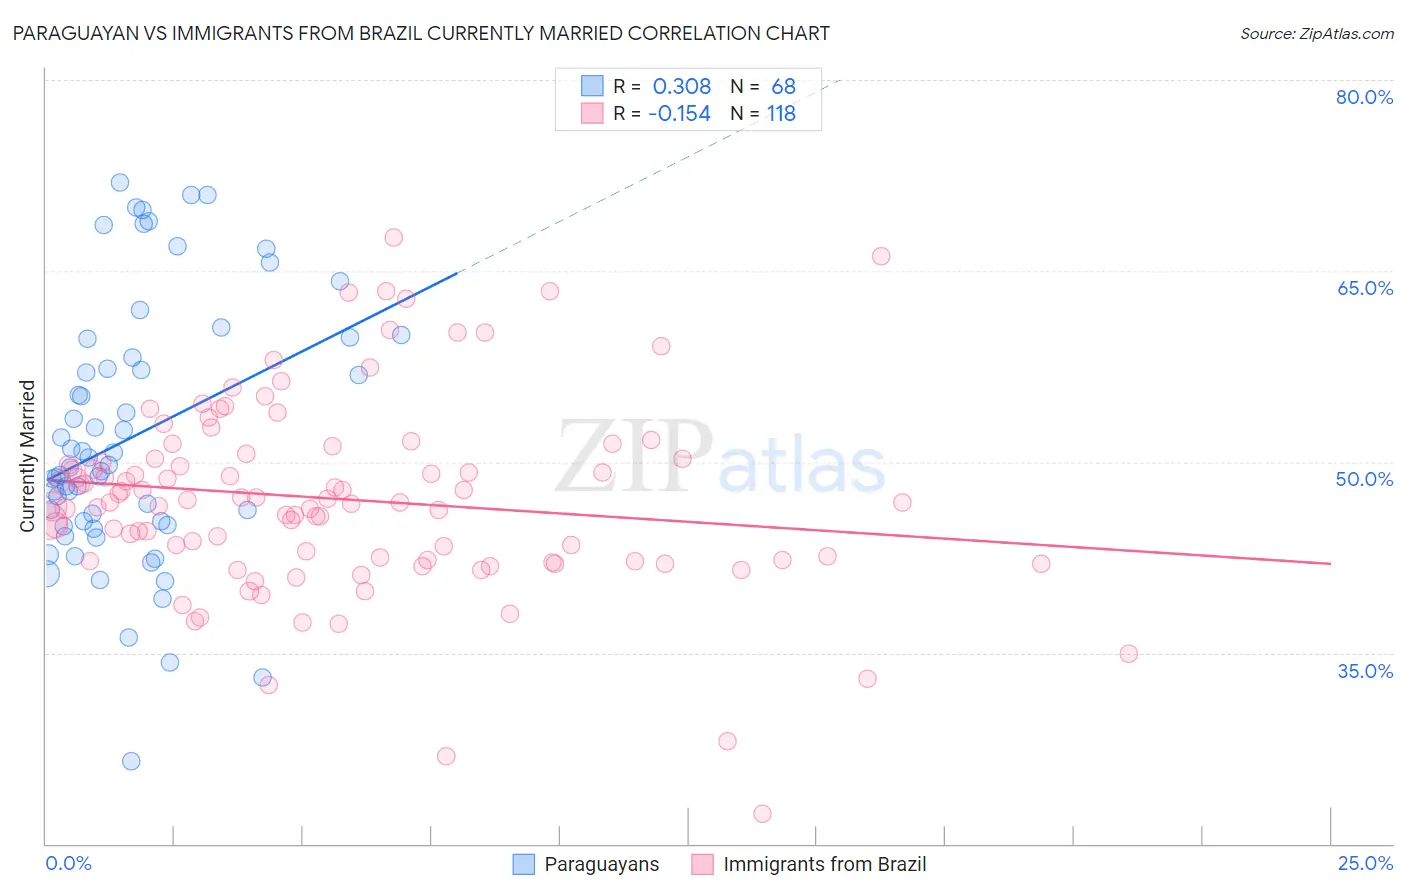
Paraguayan vs Immigrants from Brazil Currently Married Correlation Chart

The statistical analysis conducted on geographies consisting of 95,115,093 people shows a mild positive correlation between the proportion of Paraguayans and percentage of population currently married in the United States with a correlation coefficient (R) of 0.308 and weighted average of 47.2%. Similarly, the statistical analysis conducted on geographies consisting of 342,973,445 people shows a poor negative correlation between the proportion of Immigrants from Brazil and percentage of population currently married in the United States with a correlation coefficient (R) of -0.154 and weighted average of 46.6%, a difference of 1.1%.
Paraguayan vs Immigrants from Brazil Currently Married

Currently Married Correlation Summary

MeasurementParaguayanImmigrants from Brazil
Minimum26.5%22.4%
Maximum71.9%67.6%
Range45.4%45.2%
Mean52.0%47.1%
Median49.7%46.8%
Interquartile 25% (IQ1)45.2%42.3%
Interquartile 75% (IQ3)58.9%50.3%
Interquartile Range (IQR)13.8%8.0%
Standard Deviation (Sample)10.2%7.6%
Standard Deviation (Population)10.2%7.6%

Similar Demographics by Currently Married

Demographics Similar to Paraguayans by Currently Married

In terms of currently married, the demographic groups most similar to Paraguayans are Immigrants from Vietnam (47.2%, a difference of 0.020%), Pakistani (47.2%, a difference of 0.020%), Yugoslavian (47.2%, a difference of 0.020%), Immigrants from Norway (47.2%, a difference of 0.10%), and Cajun (47.1%, a difference of 0.13%).
DemographicsRating | RankCurrently Married
Immigrants | Iraq
82.8
/100
|
#130
Excellent
47.3%
Icelanders
82.4
/100
|
#131
Excellent
47.3%
Afghans
81.8
/100
|
#132
Excellent
47.3%
Immigrants | Malaysia
81.1
/100
|
#133
Excellent
47.3%
Immigrants | Australia
81.1
/100
|
#134
Excellent
47.3%
Immigrants | Norway
79.7
/100
|
#135
Good
47.2%
Immigrants | Vietnam
78.2
/100
|
#136
Good
47.2%
Paraguayans
77.8
/100
|
#137
Good
47.2%
Pakistanis
77.5
/100
|
#138
Good
47.2%
Yugoslavians
77.4
/100
|
#139
Good
47.2%
Cajuns
75.3
/100
|
#140
Good
47.1%
Venezuelans
74.4
/100
|
#141
Good
47.1%
Argentineans
74.4
/100
|
#142
Good
47.1%
Guamanians/Chamorros
74.2
/100
|
#143
Good
47.1%
Hmong
73.4
/100
|
#144
Good
47.1%

Demographics Similar to Immigrants from Brazil by Currently Married

In terms of currently married, the demographic groups most similar to Immigrants from Brazil are Peruvian (46.6%, a difference of 0.010%), Tlingit-Haida (46.7%, a difference of 0.050%), Hawaiian (46.6%, a difference of 0.050%), Israeli (46.6%, a difference of 0.050%), and Chickasaw (46.6%, a difference of 0.070%).
DemographicsRating | RankCurrently Married
Immigrants | Afghanistan
58.2
/100
|
#168
Average
46.8%
Armenians
58.2
/100
|
#169
Average
46.8%
Immigrants | Latvia
56.7
/100
|
#170
Average
46.7%
Immigrants | Zimbabwe
52.4
/100
|
#171
Average
46.7%
Aleuts
52.0
/100
|
#172
Average
46.7%
Tlingit-Haida
51.2
/100
|
#173
Average
46.7%
Peruvians
50.0
/100
|
#174
Average
46.6%
Immigrants | Brazil
49.9
/100
|
#175
Average
46.6%
Hawaiians
48.6
/100
|
#176
Average
46.6%
Israelis
48.6
/100
|
#177
Average
46.6%
Chickasaw
47.8
/100
|
#178
Average
46.6%
Immigrants | Oceania
44.6
/100
|
#179
Average
46.5%
Costa Ricans
43.7
/100
|
#180
Average
46.5%
Ottawa
43.0
/100
|
#181
Average
46.5%
Potawatomi
41.9
/100
|
#182
Average
46.5%