Paraguayan vs Puget Sound Salish Currently Married
COMPARE
Paraguayan
Puget Sound Salish
Currently Married
Currently Married Comparison
Paraguayans
Puget Sound Salish
47.2%
CURRENTLY MARRIED
77.8/ 100
METRIC RATING
137th/ 347
METRIC RANK
47.6%
CURRENTLY MARRIED
90.3/ 100
METRIC RATING
117th/ 347
METRIC RANK
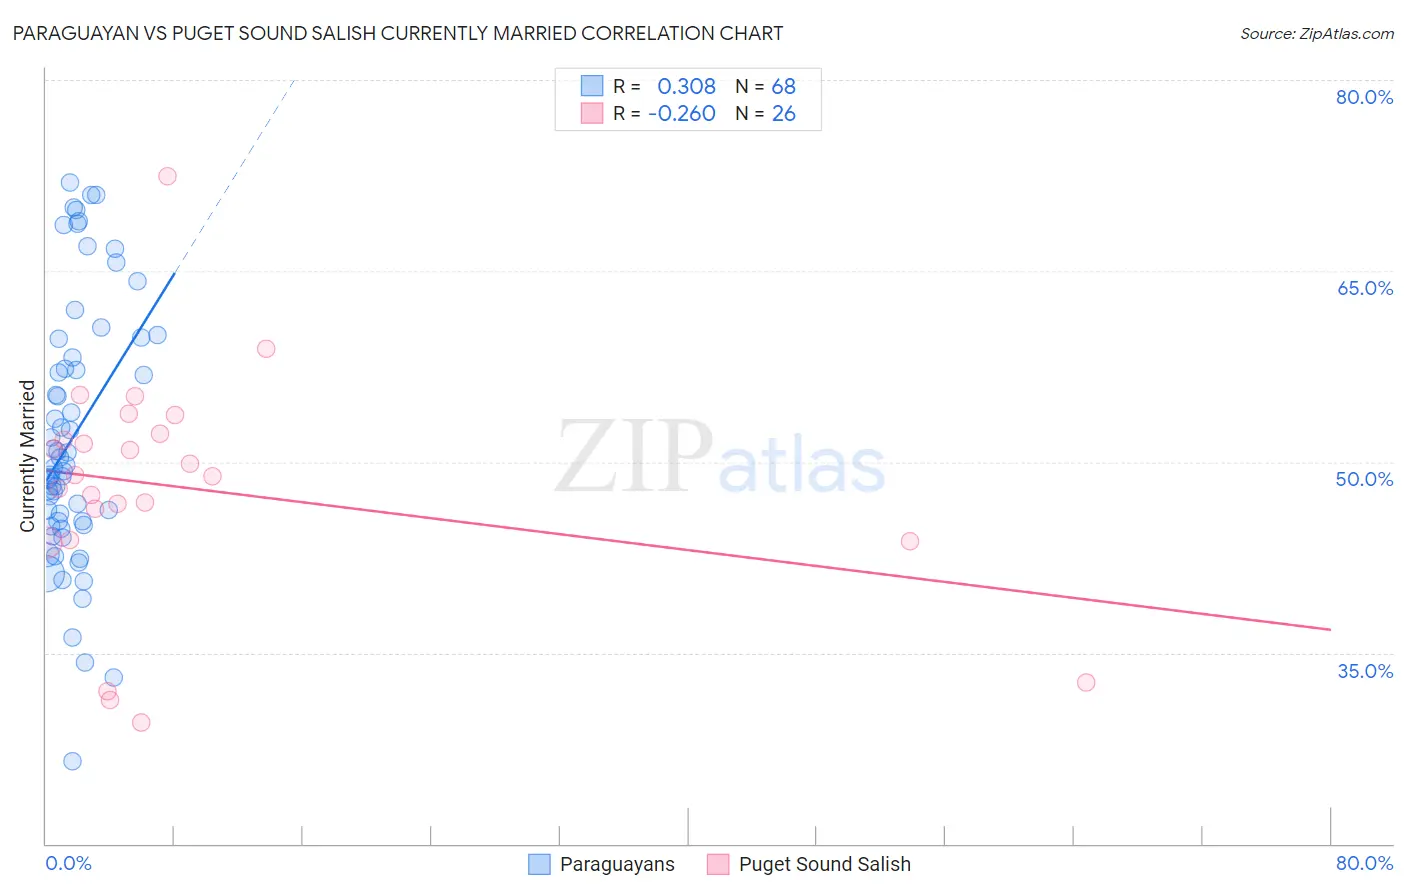
Paraguayan vs Puget Sound Salish Currently Married Correlation Chart
The statistical analysis conducted on geographies consisting of 95,115,093 people shows a mild positive correlation between the proportion of Paraguayans and percentage of population currently married in the United States with a correlation coefficient (R) of 0.308 and weighted average of 47.2%. Similarly, the statistical analysis conducted on geographies consisting of 46,155,865 people shows a weak negative correlation between the proportion of Puget Sound Salish and percentage of population currently married in the United States with a correlation coefficient (R) of -0.260 and weighted average of 47.6%, a difference of 0.88%.
Currently Married Correlation Summary
| Measurement | Paraguayan | Puget Sound Salish |
| Minimum | 26.5% | 29.5% |
| Maximum | 71.9% | 72.4% |
| Range | 45.4% | 42.9% |
| Mean | 52.0% | 47.9% |
| Median | 49.7% | 48.9% |
| Interquartile 25% (IQ1) | 45.2% | 43.9% |
| Interquartile 75% (IQ3) | 58.9% | 52.2% |
| Interquartile Range (IQR) | 13.8% | 8.3% |
| Standard Deviation (Sample) | 10.2% | 9.2% |
| Standard Deviation (Population) | 10.2% | 9.0% |
Demographics Similar to Paraguayans and Puget Sound Salish by Currently Married
In terms of currently married, the demographic groups most similar to Paraguayans are Immigrants from Vietnam (47.2%, a difference of 0.020%), Immigrants from Norway (47.2%, a difference of 0.10%), Immigrants from Malaysia (47.3%, a difference of 0.18%), Immigrants from Australia (47.3%, a difference of 0.18%), and Afghan (47.3%, a difference of 0.23%). Similarly, the demographic groups most similar to Puget Sound Salish are Immigrants from Philippines (47.6%, a difference of 0.010%), Australian (47.6%, a difference of 0.010%), Syrian (47.5%, a difference of 0.13%), Immigrants from Croatia (47.5%, a difference of 0.16%), and Osage (47.5%, a difference of 0.22%).
| Demographics | Rating | Rank | Currently Married |
| Puget Sound Salish | 90.3 /100 | #117 | Exceptional 47.6% |
| Immigrants | Philippines | 90.2 /100 | #118 | Exceptional 47.6% |
| Australians | 90.2 /100 | #119 | Exceptional 47.6% |
| Syrians | 88.9 /100 | #120 | Excellent 47.5% |
| Immigrants | Croatia | 88.6 /100 | #121 | Excellent 47.5% |
| Osage | 87.9 /100 | #122 | Excellent 47.5% |
| Immigrants | Kazakhstan | 87.2 /100 | #123 | Excellent 47.4% |
| Laotians | 86.6 /100 | #124 | Excellent 47.4% |
| Okinawans | 85.3 /100 | #125 | Excellent 47.4% |
| Immigrants | Jordan | 84.9 /100 | #126 | Excellent 47.4% |
| New Zealanders | 84.9 /100 | #127 | Excellent 47.4% |
| Portuguese | 84.2 /100 | #128 | Excellent 47.3% |
| Sri Lankans | 83.2 /100 | #129 | Excellent 47.3% |
| Immigrants | Iraq | 82.8 /100 | #130 | Excellent 47.3% |
| Icelanders | 82.4 /100 | #131 | Excellent 47.3% |
| Afghans | 81.8 /100 | #132 | Excellent 47.3% |
| Immigrants | Malaysia | 81.1 /100 | #133 | Excellent 47.3% |
| Immigrants | Australia | 81.1 /100 | #134 | Excellent 47.3% |
| Immigrants | Norway | 79.7 /100 | #135 | Good 47.2% |
| Immigrants | Vietnam | 78.2 /100 | #136 | Good 47.2% |
| Paraguayans | 77.8 /100 | #137 | Good 47.2% |