Canadian vs Immigrants from Brazil Currently Married
COMPARE
Canadian
Immigrants from Brazil
Currently Married
Currently Married Comparison
Canadians
Immigrants from Brazil
48.3%
CURRENTLY MARRIED
98.1/ 100
METRIC RATING
69th/ 347
METRIC RANK
46.6%
CURRENTLY MARRIED
49.9/ 100
METRIC RATING
175th/ 347
METRIC RANK
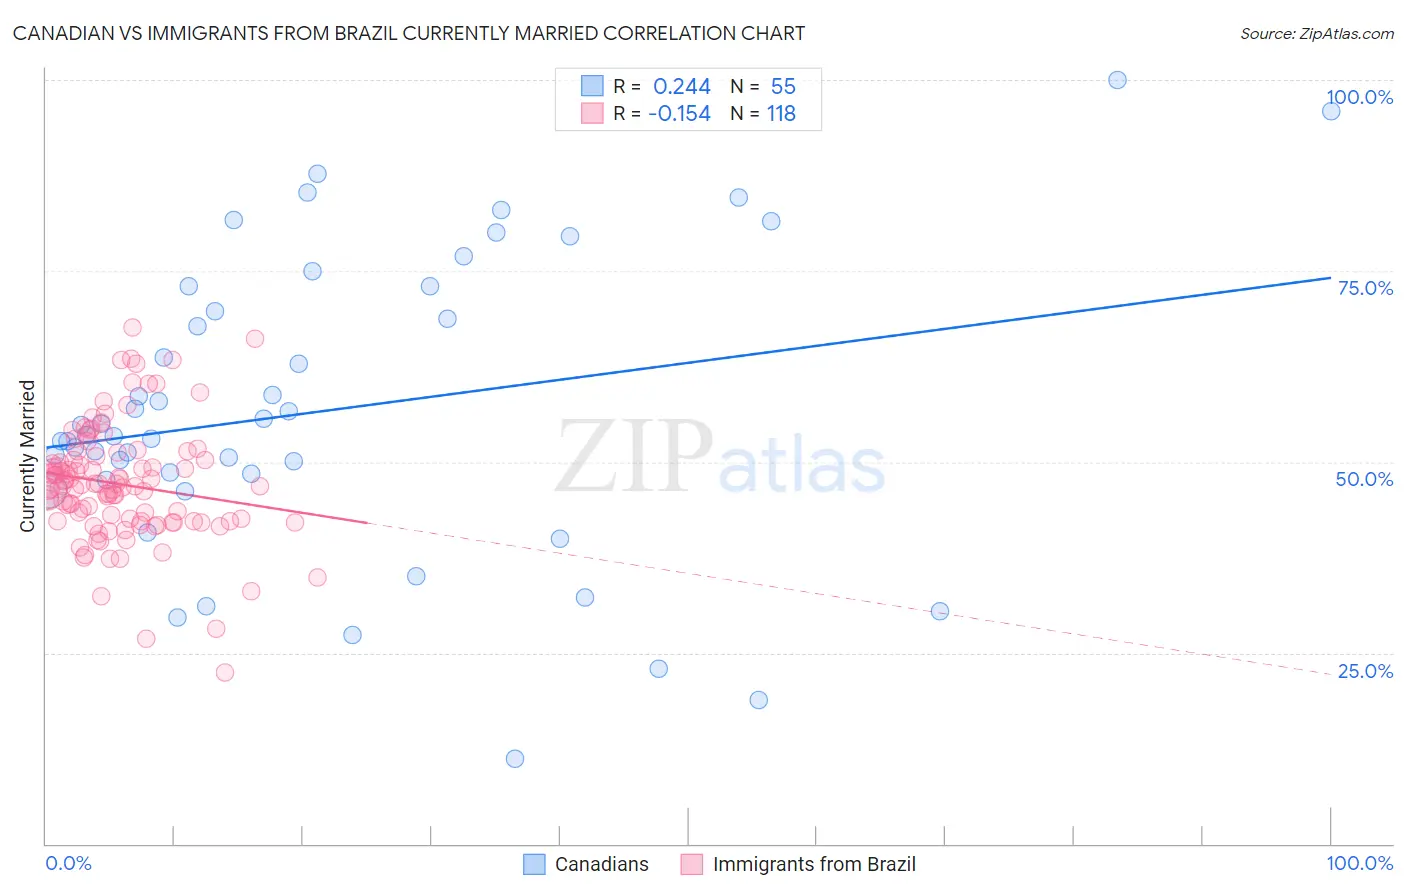
Canadian vs Immigrants from Brazil Currently Married Correlation Chart
The statistical analysis conducted on geographies consisting of 437,507,905 people shows a weak positive correlation between the proportion of Canadians and percentage of population currently married in the United States with a correlation coefficient (R) of 0.244 and weighted average of 48.3%. Similarly, the statistical analysis conducted on geographies consisting of 342,973,445 people shows a poor negative correlation between the proportion of Immigrants from Brazil and percentage of population currently married in the United States with a correlation coefficient (R) of -0.154 and weighted average of 46.6%, a difference of 3.6%.
Currently Married Correlation Summary
| Measurement | Canadian | Immigrants from Brazil |
| Minimum | 11.1% | 22.4% |
| Maximum | 100.0% | 67.6% |
| Range | 88.9% | 45.2% |
| Mean | 56.8% | 47.1% |
| Median | 53.5% | 46.8% |
| Interquartile 25% (IQ1) | 47.6% | 42.3% |
| Interquartile 75% (IQ3) | 73.0% | 50.3% |
| Interquartile Range (IQR) | 25.3% | 8.0% |
| Standard Deviation (Sample) | 19.6% | 7.6% |
| Standard Deviation (Population) | 19.4% | 7.6% |
Similar Demographics by Currently Married
Demographics Similar to Canadians by Currently Married
In terms of currently married, the demographic groups most similar to Canadians are Slovak (48.3%, a difference of 0.020%), Immigrants from England (48.3%, a difference of 0.020%), Tongan (48.3%, a difference of 0.040%), Immigrants from Czechoslovakia (48.4%, a difference of 0.070%), and Ukrainian (48.4%, a difference of 0.070%).
| Demographics | Rating | Rank | Currently Married |
| Asians | 98.5 /100 | #62 | Exceptional 48.4% |
| Slavs | 98.3 /100 | #63 | Exceptional 48.4% |
| Immigrants | Czechoslovakia | 98.3 /100 | #64 | Exceptional 48.4% |
| Ukrainians | 98.3 /100 | #65 | Exceptional 48.4% |
| Tongans | 98.2 /100 | #66 | Exceptional 48.3% |
| Slovaks | 98.2 /100 | #67 | Exceptional 48.3% |
| Immigrants | England | 98.2 /100 | #68 | Exceptional 48.3% |
| Canadians | 98.1 /100 | #69 | Exceptional 48.3% |
| Immigrants | Asia | 97.9 /100 | #70 | Exceptional 48.3% |
| Macedonians | 97.9 /100 | #71 | Exceptional 48.3% |
| Immigrants | Lebanon | 97.6 /100 | #72 | Exceptional 48.2% |
| Immigrants | Eastern Asia | 97.5 /100 | #73 | Exceptional 48.2% |
| Estonians | 97.4 /100 | #74 | Exceptional 48.2% |
| Immigrants | Belarus | 97.2 /100 | #75 | Exceptional 48.1% |
| Basques | 97.2 /100 | #76 | Exceptional 48.1% |
Demographics Similar to Immigrants from Brazil by Currently Married
In terms of currently married, the demographic groups most similar to Immigrants from Brazil are Peruvian (46.6%, a difference of 0.010%), Tlingit-Haida (46.7%, a difference of 0.050%), Hawaiian (46.6%, a difference of 0.050%), Israeli (46.6%, a difference of 0.050%), and Chickasaw (46.6%, a difference of 0.070%).
| Demographics | Rating | Rank | Currently Married |
| Immigrants | Afghanistan | 58.2 /100 | #168 | Average 46.8% |
| Armenians | 58.2 /100 | #169 | Average 46.8% |
| Immigrants | Latvia | 56.7 /100 | #170 | Average 46.7% |
| Immigrants | Zimbabwe | 52.4 /100 | #171 | Average 46.7% |
| Aleuts | 52.0 /100 | #172 | Average 46.7% |
| Tlingit-Haida | 51.2 /100 | #173 | Average 46.7% |
| Peruvians | 50.0 /100 | #174 | Average 46.6% |
| Immigrants | Brazil | 49.9 /100 | #175 | Average 46.6% |
| Hawaiians | 48.6 /100 | #176 | Average 46.6% |
| Israelis | 48.6 /100 | #177 | Average 46.6% |
| Chickasaw | 47.8 /100 | #178 | Average 46.6% |
| Immigrants | Oceania | 44.6 /100 | #179 | Average 46.5% |
| Costa Ricans | 43.7 /100 | #180 | Average 46.5% |
| Ottawa | 43.0 /100 | #181 | Average 46.5% |
| Potawatomi | 41.9 /100 | #182 | Average 46.5% |