Arab vs Immigrants from Brazil Currently Married
COMPARE
Arab
Immigrants from Brazil
Currently Married
Currently Married Comparison
Arabs
Immigrants from Brazil
47.0%
CURRENTLY MARRIED
68.6/ 100
METRIC RATING
155th/ 347
METRIC RANK
46.6%
CURRENTLY MARRIED
49.9/ 100
METRIC RATING
175th/ 347
METRIC RANK
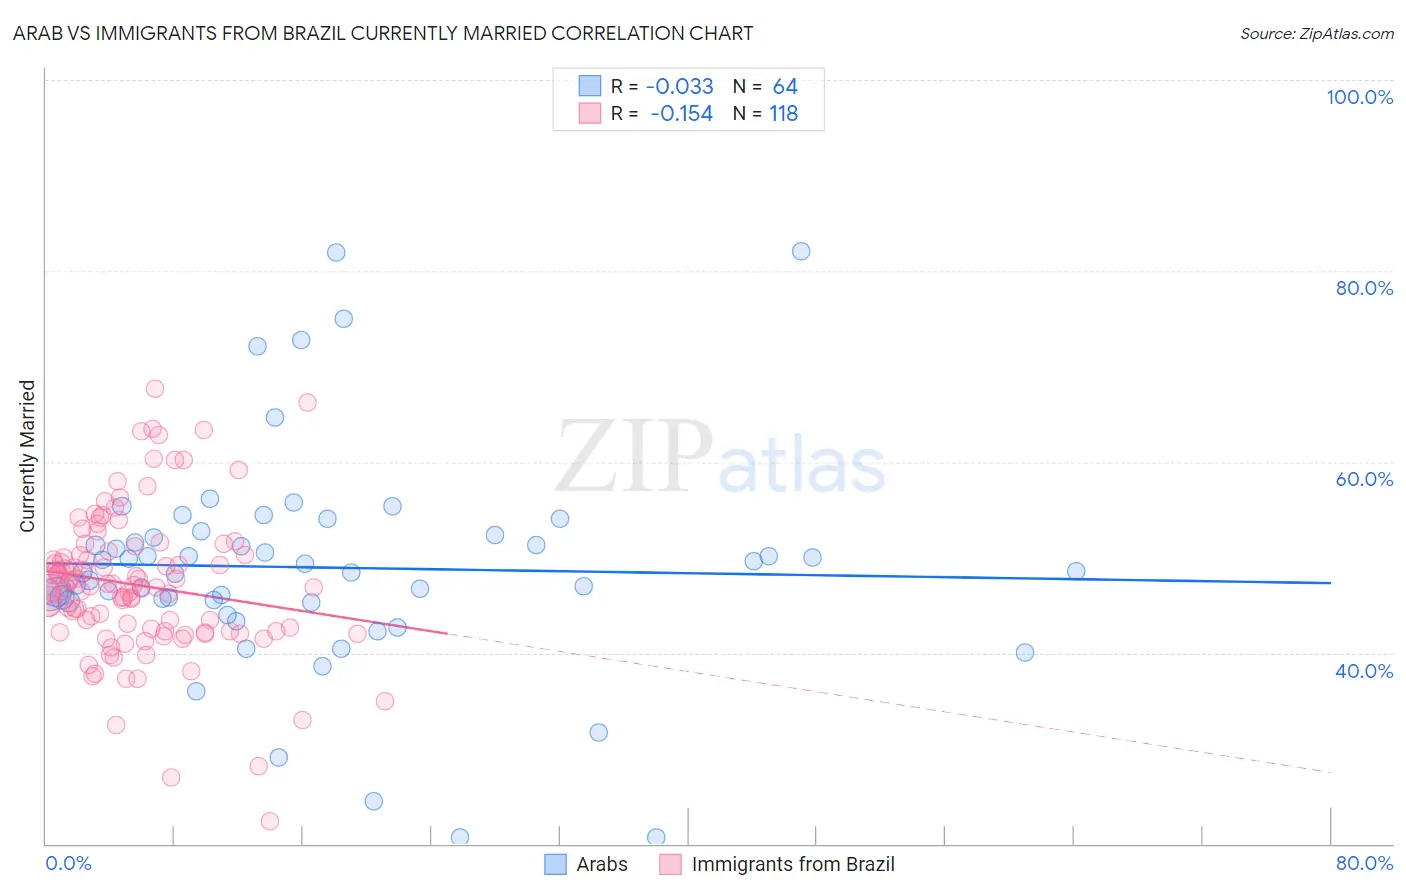
Arab vs Immigrants from Brazil Currently Married Correlation Chart
The statistical analysis conducted on geographies consisting of 486,767,077 people shows no correlation between the proportion of Arabs and percentage of population currently married in the United States with a correlation coefficient (R) of -0.033 and weighted average of 47.0%. Similarly, the statistical analysis conducted on geographies consisting of 342,973,445 people shows a poor negative correlation between the proportion of Immigrants from Brazil and percentage of population currently married in the United States with a correlation coefficient (R) of -0.154 and weighted average of 46.6%, a difference of 0.72%.
Currently Married Correlation Summary
| Measurement | Arab | Immigrants from Brazil |
| Minimum | 20.6% | 22.4% |
| Maximum | 82.1% | 67.6% |
| Range | 61.5% | 45.2% |
| Mean | 48.9% | 47.1% |
| Median | 48.5% | 46.8% |
| Interquartile 25% (IQ1) | 45.4% | 42.3% |
| Interquartile 75% (IQ3) | 52.2% | 50.3% |
| Interquartile Range (IQR) | 6.7% | 8.0% |
| Standard Deviation (Sample) | 11.4% | 7.6% |
| Standard Deviation (Population) | 11.3% | 7.6% |
Demographics Similar to Arabs and Immigrants from Brazil by Currently Married
In terms of currently married, the demographic groups most similar to Arabs are Spanish (47.0%, a difference of 0.020%), Immigrants from Switzerland (46.9%, a difference of 0.030%), Cherokee (46.9%, a difference of 0.070%), Iraqi (46.9%, a difference of 0.090%), and Immigrants from Uzbekistan (46.9%, a difference of 0.11%). Similarly, the demographic groups most similar to Immigrants from Brazil are Peruvian (46.6%, a difference of 0.010%), Tlingit-Haida (46.7%, a difference of 0.050%), Aleut (46.7%, a difference of 0.080%), Immigrants from Zimbabwe (46.7%, a difference of 0.090%), and Immigrants from Latvia (46.7%, a difference of 0.25%).
| Demographics | Rating | Rank | Currently Married |
| Arabs | 68.6 /100 | #155 | Good 47.0% |
| Spanish | 68.1 /100 | #156 | Good 47.0% |
| Immigrants | Switzerland | 67.8 /100 | #157 | Good 46.9% |
| Cherokee | 66.8 /100 | #158 | Good 46.9% |
| Iraqis | 66.4 /100 | #159 | Good 46.9% |
| Immigrants | Uzbekistan | 66.0 /100 | #160 | Good 46.9% |
| Immigrants | Southern Europe | 65.9 /100 | #161 | Good 46.9% |
| Immigrants | Nonimmigrants | 65.4 /100 | #162 | Good 46.9% |
| Delaware | 64.7 /100 | #163 | Good 46.9% |
| Immigrants | Western Asia | 64.2 /100 | #164 | Good 46.9% |
| Samoans | 59.8 /100 | #165 | Average 46.8% |
| Immigrants | Syria | 59.3 /100 | #166 | Average 46.8% |
| Spaniards | 58.8 /100 | #167 | Average 46.8% |
| Immigrants | Afghanistan | 58.2 /100 | #168 | Average 46.8% |
| Armenians | 58.2 /100 | #169 | Average 46.8% |
| Immigrants | Latvia | 56.7 /100 | #170 | Average 46.7% |
| Immigrants | Zimbabwe | 52.4 /100 | #171 | Average 46.7% |
| Aleuts | 52.0 /100 | #172 | Average 46.7% |
| Tlingit-Haida | 51.2 /100 | #173 | Average 46.7% |
| Peruvians | 50.0 /100 | #174 | Average 46.6% |
| Immigrants | Brazil | 49.9 /100 | #175 | Average 46.6% |