Paraguayan vs Mongolian Currently Married
COMPARE
Paraguayan
Mongolian
Currently Married
Currently Married Comparison
Paraguayans
Mongolians
47.2%
CURRENTLY MARRIED
77.8/ 100
METRIC RATING
137th/ 347
METRIC RANK
46.4%
CURRENTLY MARRIED
37.6/ 100
METRIC RATING
185th/ 347
METRIC RANK
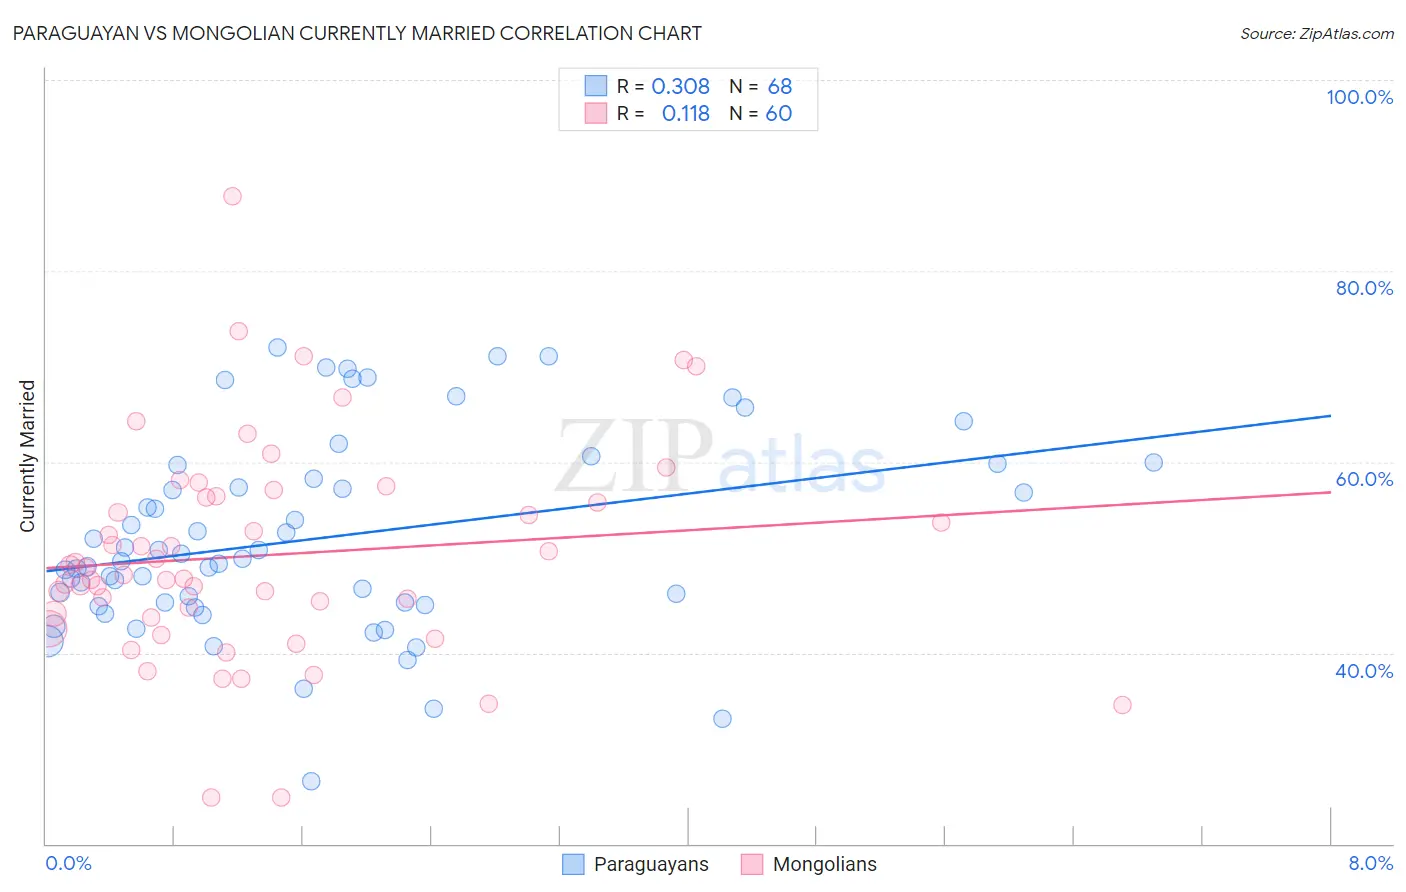
Paraguayan vs Mongolian Currently Married Correlation Chart
The statistical analysis conducted on geographies consisting of 95,115,093 people shows a mild positive correlation between the proportion of Paraguayans and percentage of population currently married in the United States with a correlation coefficient (R) of 0.308 and weighted average of 47.2%. Similarly, the statistical analysis conducted on geographies consisting of 140,349,335 people shows a poor positive correlation between the proportion of Mongolians and percentage of population currently married in the United States with a correlation coefficient (R) of 0.118 and weighted average of 46.4%, a difference of 1.6%.
Currently Married Correlation Summary
| Measurement | Paraguayan | Mongolian |
| Minimum | 26.5% | 24.8% |
| Maximum | 71.9% | 87.8% |
| Range | 45.4% | 63.0% |
| Mean | 52.0% | 50.2% |
| Median | 49.7% | 48.6% |
| Interquartile 25% (IQ1) | 45.2% | 43.9% |
| Interquartile 75% (IQ3) | 58.9% | 56.3% |
| Interquartile Range (IQR) | 13.8% | 12.4% |
| Standard Deviation (Sample) | 10.2% | 11.3% |
| Standard Deviation (Population) | 10.2% | 11.3% |
Similar Demographics by Currently Married
Demographics Similar to Paraguayans by Currently Married
In terms of currently married, the demographic groups most similar to Paraguayans are Immigrants from Vietnam (47.2%, a difference of 0.020%), Pakistani (47.2%, a difference of 0.020%), Yugoslavian (47.2%, a difference of 0.020%), Immigrants from Norway (47.2%, a difference of 0.10%), and Cajun (47.1%, a difference of 0.13%).
| Demographics | Rating | Rank | Currently Married |
| Immigrants | Iraq | 82.8 /100 | #130 | Excellent 47.3% |
| Icelanders | 82.4 /100 | #131 | Excellent 47.3% |
| Afghans | 81.8 /100 | #132 | Excellent 47.3% |
| Immigrants | Malaysia | 81.1 /100 | #133 | Excellent 47.3% |
| Immigrants | Australia | 81.1 /100 | #134 | Excellent 47.3% |
| Immigrants | Norway | 79.7 /100 | #135 | Good 47.2% |
| Immigrants | Vietnam | 78.2 /100 | #136 | Good 47.2% |
| Paraguayans | 77.8 /100 | #137 | Good 47.2% |
| Pakistanis | 77.5 /100 | #138 | Good 47.2% |
| Yugoslavians | 77.4 /100 | #139 | Good 47.2% |
| Cajuns | 75.3 /100 | #140 | Good 47.1% |
| Venezuelans | 74.4 /100 | #141 | Good 47.1% |
| Argentineans | 74.4 /100 | #142 | Good 47.1% |
| Guamanians/Chamorros | 74.2 /100 | #143 | Good 47.1% |
| Hmong | 73.4 /100 | #144 | Good 47.1% |
Demographics Similar to Mongolians by Currently Married
In terms of currently married, the demographic groups most similar to Mongolians are Immigrants from Chile (46.4%, a difference of 0.030%), Brazilian (46.4%, a difference of 0.070%), Immigrants from Northern Africa (46.5%, a difference of 0.080%), Immigrants from Peru (46.4%, a difference of 0.090%), and Potawatomi (46.5%, a difference of 0.16%).
| Demographics | Rating | Rank | Currently Married |
| Chickasaw | 47.8 /100 | #178 | Average 46.6% |
| Immigrants | Oceania | 44.6 /100 | #179 | Average 46.5% |
| Costa Ricans | 43.7 /100 | #180 | Average 46.5% |
| Ottawa | 43.0 /100 | #181 | Average 46.5% |
| Potawatomi | 41.9 /100 | #182 | Average 46.5% |
| Immigrants | Northern Africa | 39.7 /100 | #183 | Fair 46.5% |
| Brazilians | 39.3 /100 | #184 | Fair 46.4% |
| Mongolians | 37.6 /100 | #185 | Fair 46.4% |
| Immigrants | Chile | 36.8 /100 | #186 | Fair 46.4% |
| Immigrants | Peru | 35.3 /100 | #187 | Fair 46.4% |
| Colombians | 31.8 /100 | #188 | Fair 46.3% |
| Fijians | 30.3 /100 | #189 | Fair 46.3% |
| Choctaw | 29.1 /100 | #190 | Fair 46.3% |
| Immigrants | France | 27.7 /100 | #191 | Fair 46.2% |
| Soviet Union | 25.7 /100 | #192 | Fair 46.2% |