Paraguayan vs Immigrants from Lithuania Currently Married
COMPARE
Paraguayan
Immigrants from Lithuania
Currently Married
Currently Married Comparison
Paraguayans
Immigrants from Lithuania
47.2%
CURRENTLY MARRIED
77.8/ 100
METRIC RATING
137th/ 347
METRIC RANK
48.8%
CURRENTLY MARRIED
99.4/ 100
METRIC RATING
34th/ 347
METRIC RANK
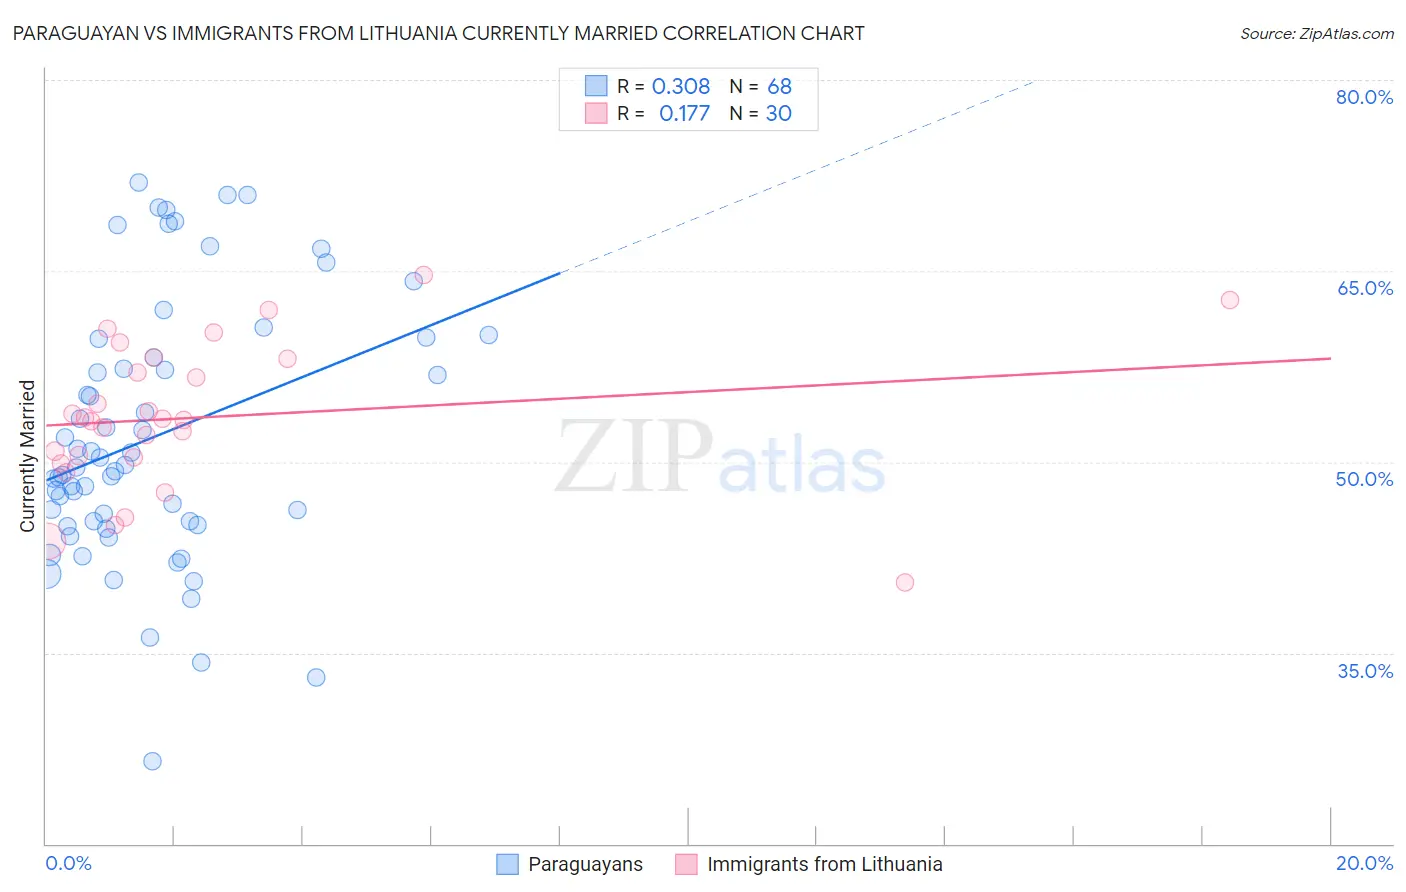
Paraguayan vs Immigrants from Lithuania Currently Married Correlation Chart
The statistical analysis conducted on geographies consisting of 95,115,093 people shows a mild positive correlation between the proportion of Paraguayans and percentage of population currently married in the United States with a correlation coefficient (R) of 0.308 and weighted average of 47.2%. Similarly, the statistical analysis conducted on geographies consisting of 117,724,932 people shows a poor positive correlation between the proportion of Immigrants from Lithuania and percentage of population currently married in the United States with a correlation coefficient (R) of 0.177 and weighted average of 48.8%, a difference of 3.6%.
Currently Married Correlation Summary
| Measurement | Paraguayan | Immigrants from Lithuania |
| Minimum | 26.5% | 40.5% |
| Maximum | 71.9% | 64.7% |
| Range | 45.4% | 24.2% |
| Mean | 52.0% | 53.5% |
| Median | 49.7% | 53.4% |
| Interquartile 25% (IQ1) | 45.2% | 50.4% |
| Interquartile 75% (IQ3) | 58.9% | 58.1% |
| Interquartile Range (IQR) | 13.8% | 7.8% |
| Standard Deviation (Sample) | 10.2% | 5.8% |
| Standard Deviation (Population) | 10.2% | 5.7% |
Similar Demographics by Currently Married
Demographics Similar to Paraguayans by Currently Married
In terms of currently married, the demographic groups most similar to Paraguayans are Immigrants from Vietnam (47.2%, a difference of 0.020%), Pakistani (47.2%, a difference of 0.020%), Yugoslavian (47.2%, a difference of 0.020%), Immigrants from Norway (47.2%, a difference of 0.10%), and Cajun (47.1%, a difference of 0.13%).
| Demographics | Rating | Rank | Currently Married |
| Immigrants | Iraq | 82.8 /100 | #130 | Excellent 47.3% |
| Icelanders | 82.4 /100 | #131 | Excellent 47.3% |
| Afghans | 81.8 /100 | #132 | Excellent 47.3% |
| Immigrants | Malaysia | 81.1 /100 | #133 | Excellent 47.3% |
| Immigrants | Australia | 81.1 /100 | #134 | Excellent 47.3% |
| Immigrants | Norway | 79.7 /100 | #135 | Good 47.2% |
| Immigrants | Vietnam | 78.2 /100 | #136 | Good 47.2% |
| Paraguayans | 77.8 /100 | #137 | Good 47.2% |
| Pakistanis | 77.5 /100 | #138 | Good 47.2% |
| Yugoslavians | 77.4 /100 | #139 | Good 47.2% |
| Cajuns | 75.3 /100 | #140 | Good 47.1% |
| Venezuelans | 74.4 /100 | #141 | Good 47.1% |
| Argentineans | 74.4 /100 | #142 | Good 47.1% |
| Guamanians/Chamorros | 74.2 /100 | #143 | Good 47.1% |
| Hmong | 73.4 /100 | #144 | Good 47.1% |
Demographics Similar to Immigrants from Lithuania by Currently Married
In terms of currently married, the demographic groups most similar to Immigrants from Lithuania are Immigrants from Northern Europe (48.8%, a difference of 0.020%), Italian (48.8%, a difference of 0.030%), Hungarian (48.8%, a difference of 0.030%), Irish (48.9%, a difference of 0.060%), and Czechoslovakian (48.8%, a difference of 0.070%).
| Demographics | Rating | Rank | Currently Married |
| Burmese | 99.6 /100 | #27 | Exceptional 48.9% |
| Welsh | 99.5 /100 | #28 | Exceptional 48.9% |
| Croatians | 99.5 /100 | #29 | Exceptional 48.9% |
| Eastern Europeans | 99.5 /100 | #30 | Exceptional 48.9% |
| Poles | 99.5 /100 | #31 | Exceptional 48.9% |
| Immigrants | Hong Kong | 99.5 /100 | #32 | Exceptional 48.9% |
| Irish | 99.5 /100 | #33 | Exceptional 48.9% |
| Immigrants | Lithuania | 99.4 /100 | #34 | Exceptional 48.8% |
| Immigrants | Northern Europe | 99.4 /100 | #35 | Exceptional 48.8% |
| Italians | 99.4 /100 | #36 | Exceptional 48.8% |
| Hungarians | 99.4 /100 | #37 | Exceptional 48.8% |
| Czechoslovakians | 99.4 /100 | #38 | Exceptional 48.8% |
| British | 99.4 /100 | #39 | Exceptional 48.8% |
| Immigrants | Canada | 99.4 /100 | #40 | Exceptional 48.8% |
| Greeks | 99.3 /100 | #41 | Exceptional 48.8% |