Immigrants from Fiji vs Immigrants from Brazil Currently Married
COMPARE
Immigrants from Fiji
Immigrants from Brazil
Currently Married
Currently Married Comparison
Immigrants from Fiji
Immigrants from Brazil
46.2%
CURRENTLY MARRIED
25.0/ 100
METRIC RATING
193rd/ 347
METRIC RANK
46.6%
CURRENTLY MARRIED
49.9/ 100
METRIC RATING
175th/ 347
METRIC RANK
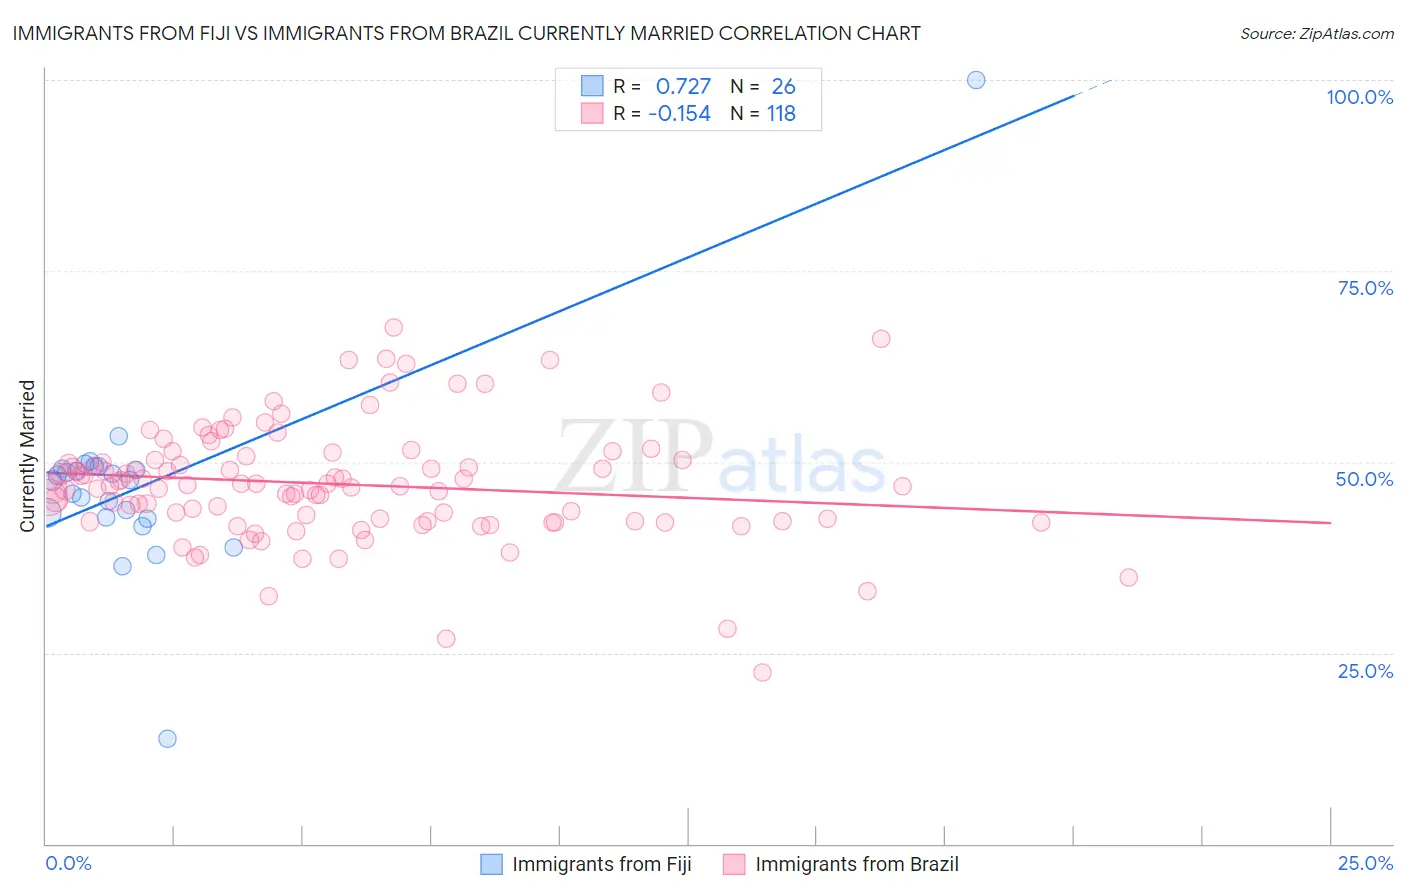
Immigrants from Fiji vs Immigrants from Brazil Currently Married Correlation Chart
The statistical analysis conducted on geographies consisting of 93,756,204 people shows a strong positive correlation between the proportion of Immigrants from Fiji and percentage of population currently married in the United States with a correlation coefficient (R) of 0.727 and weighted average of 46.2%. Similarly, the statistical analysis conducted on geographies consisting of 342,973,445 people shows a poor negative correlation between the proportion of Immigrants from Brazil and percentage of population currently married in the United States with a correlation coefficient (R) of -0.154 and weighted average of 46.6%, a difference of 1.0%.
Currently Married Correlation Summary
| Measurement | Immigrants from Fiji | Immigrants from Brazil |
| Minimum | 13.7% | 22.4% |
| Maximum | 100.0% | 67.6% |
| Range | 86.3% | 45.2% |
| Mean | 46.8% | 47.1% |
| Median | 47.6% | 46.8% |
| Interquartile 25% (IQ1) | 42.7% | 42.3% |
| Interquartile 75% (IQ3) | 49.1% | 50.3% |
| Interquartile Range (IQR) | 6.4% | 8.0% |
| Standard Deviation (Sample) | 13.2% | 7.6% |
| Standard Deviation (Population) | 13.0% | 7.6% |
Demographics Similar to Immigrants from Fiji and Immigrants from Brazil by Currently Married
In terms of currently married, the demographic groups most similar to Immigrants from Fiji are Soviet Union (46.2%, a difference of 0.040%), South American (46.1%, a difference of 0.060%), Immigrants from France (46.2%, a difference of 0.13%), Choctaw (46.3%, a difference of 0.19%), and Fijian (46.3%, a difference of 0.25%). Similarly, the demographic groups most similar to Immigrants from Brazil are Peruvian (46.6%, a difference of 0.010%), Hawaiian (46.6%, a difference of 0.050%), Israeli (46.6%, a difference of 0.050%), Chickasaw (46.6%, a difference of 0.070%), and Immigrants from Oceania (46.5%, a difference of 0.19%).
| Demographics | Rating | Rank | Currently Married |
| Peruvians | 50.0 /100 | #174 | Average 46.6% |
| Immigrants | Brazil | 49.9 /100 | #175 | Average 46.6% |
| Hawaiians | 48.6 /100 | #176 | Average 46.6% |
| Israelis | 48.6 /100 | #177 | Average 46.6% |
| Chickasaw | 47.8 /100 | #178 | Average 46.6% |
| Immigrants | Oceania | 44.6 /100 | #179 | Average 46.5% |
| Costa Ricans | 43.7 /100 | #180 | Average 46.5% |
| Ottawa | 43.0 /100 | #181 | Average 46.5% |
| Potawatomi | 41.9 /100 | #182 | Average 46.5% |
| Immigrants | Northern Africa | 39.7 /100 | #183 | Fair 46.5% |
| Brazilians | 39.3 /100 | #184 | Fair 46.4% |
| Mongolians | 37.6 /100 | #185 | Fair 46.4% |
| Immigrants | Chile | 36.8 /100 | #186 | Fair 46.4% |
| Immigrants | Peru | 35.3 /100 | #187 | Fair 46.4% |
| Colombians | 31.8 /100 | #188 | Fair 46.3% |
| Fijians | 30.3 /100 | #189 | Fair 46.3% |
| Choctaw | 29.1 /100 | #190 | Fair 46.3% |
| Immigrants | France | 27.7 /100 | #191 | Fair 46.2% |
| Soviet Union | 25.7 /100 | #192 | Fair 46.2% |
| Immigrants | Fiji | 25.0 /100 | #193 | Fair 46.2% |
| South Americans | 23.8 /100 | #194 | Fair 46.1% |