Immigrants vs Chippewa Currently Married
COMPARE
Immigrants
Chippewa
Currently Married
Currently Married Comparison
Immigrants
Chippewa
45.8%
CURRENTLY MARRIED
11.2/ 100
METRIC RATING
206th/ 347
METRIC RANK
43.2%
CURRENTLY MARRIED
0.0/ 100
METRIC RATING
281st/ 347
METRIC RANK
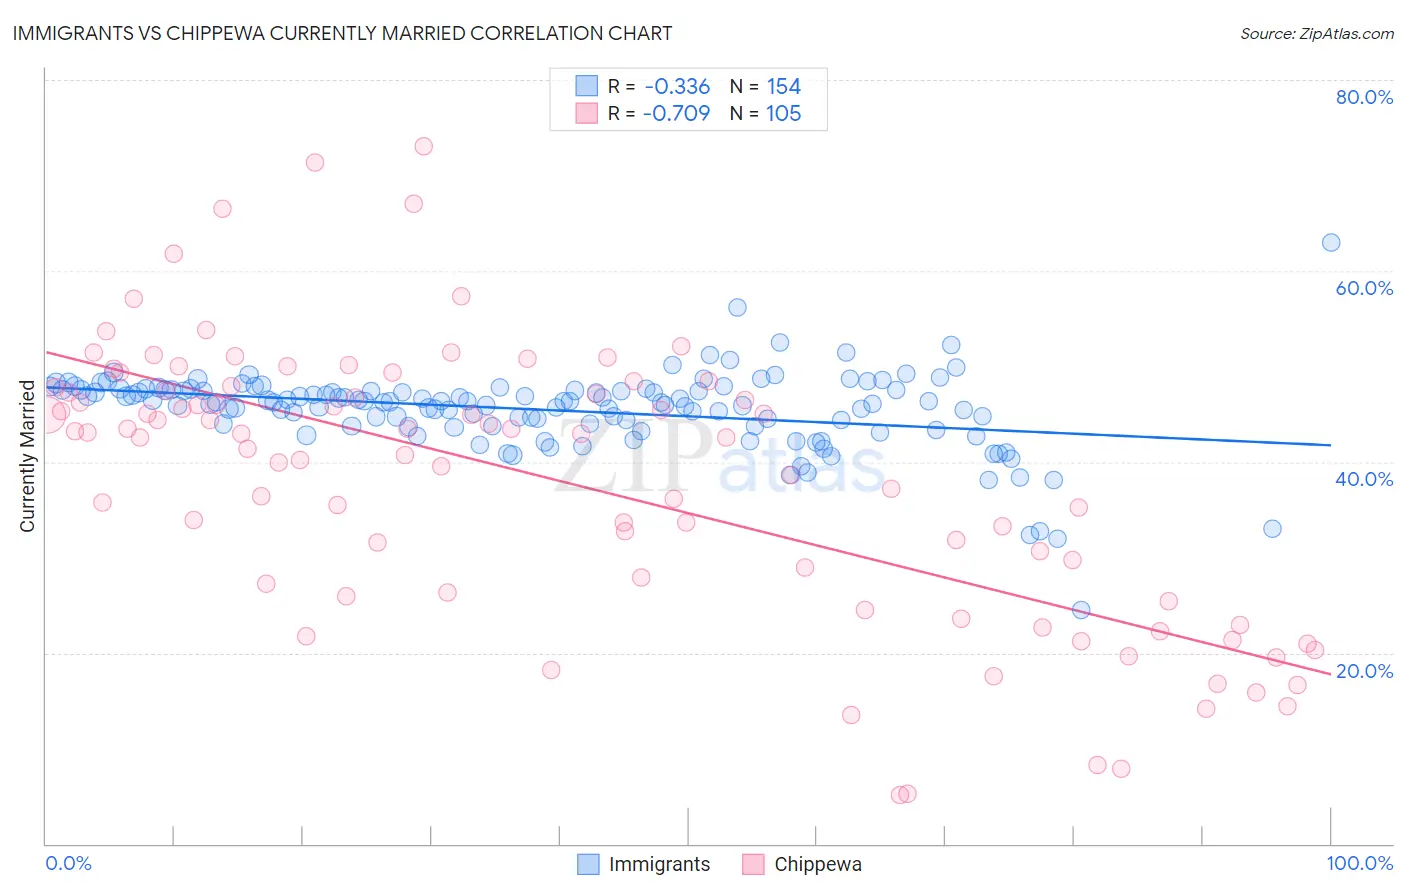
Immigrants vs Chippewa Currently Married Correlation Chart
The statistical analysis conducted on geographies consisting of 577,640,121 people shows a mild negative correlation between the proportion of Immigrants and percentage of population currently married in the United States with a correlation coefficient (R) of -0.336 and weighted average of 45.8%. Similarly, the statistical analysis conducted on geographies consisting of 215,057,083 people shows a strong negative correlation between the proportion of Chippewa and percentage of population currently married in the United States with a correlation coefficient (R) of -0.709 and weighted average of 43.2%, a difference of 5.8%.
Currently Married Correlation Summary
| Measurement | Immigrants | Chippewa |
| Minimum | 24.5% | 5.1% |
| Maximum | 62.9% | 73.1% |
| Range | 38.5% | 68.0% |
| Mean | 45.4% | 38.0% |
| Median | 46.3% | 42.5% |
| Interquartile 25% (IQ1) | 43.8% | 26.1% |
| Interquartile 75% (IQ3) | 47.5% | 47.6% |
| Interquartile Range (IQR) | 3.7% | 21.5% |
| Standard Deviation (Sample) | 4.2% | 14.5% |
| Standard Deviation (Population) | 4.2% | 14.4% |
Similar Demographics by Currently Married
Demographics Similar to Immigrants by Currently Married
In terms of currently married, the demographic groups most similar to Immigrants are South American Indian (45.8%, a difference of 0.020%), Taiwanese (45.8%, a difference of 0.040%), Immigrants from Spain (45.8%, a difference of 0.040%), Immigrants from South America (45.7%, a difference of 0.040%), and Alsatian (45.7%, a difference of 0.050%).
| Demographics | Rating | Rank | Currently Married |
| Immigrants | Costa Rica | 19.6 /100 | #199 | Poor 46.0% |
| Creek | 17.2 /100 | #200 | Poor 46.0% |
| Malaysians | 15.3 /100 | #201 | Poor 45.9% |
| Immigrants | Albania | 14.5 /100 | #202 | Poor 45.9% |
| Taiwanese | 11.7 /100 | #203 | Poor 45.8% |
| Immigrants | Spain | 11.6 /100 | #204 | Poor 45.8% |
| South American Indians | 11.5 /100 | #205 | Poor 45.8% |
| Immigrants | Immigrants | 11.2 /100 | #206 | Poor 45.8% |
| Immigrants | South America | 10.8 /100 | #207 | Poor 45.7% |
| Alsatians | 10.8 /100 | #208 | Poor 45.7% |
| Immigrants | Micronesia | 8.8 /100 | #209 | Tragic 45.6% |
| Uruguayans | 7.9 /100 | #210 | Tragic 45.6% |
| Houma | 7.2 /100 | #211 | Tragic 45.5% |
| Marshallese | 7.2 /100 | #212 | Tragic 45.5% |
| Alaska Natives | 7.0 /100 | #213 | Tragic 45.5% |
Demographics Similar to Chippewa by Currently Married
In terms of currently married, the demographic groups most similar to Chippewa are Apache (43.2%, a difference of 0.010%), Immigrants from Ecuador (43.2%, a difference of 0.070%), Central American Indian (43.3%, a difference of 0.080%), Kiowa (43.2%, a difference of 0.19%), and Immigrants from El Salvador (43.1%, a difference of 0.20%).
| Demographics | Rating | Rank | Currently Married |
| Nigerians | 0.1 /100 | #274 | Tragic 43.4% |
| Colville | 0.1 /100 | #275 | Tragic 43.4% |
| Sierra Leoneans | 0.1 /100 | #276 | Tragic 43.4% |
| Immigrants | Nigeria | 0.1 /100 | #277 | Tragic 43.4% |
| Central Americans | 0.0 /100 | #278 | Tragic 43.3% |
| Central American Indians | 0.0 /100 | #279 | Tragic 43.3% |
| Apache | 0.0 /100 | #280 | Tragic 43.2% |
| Chippewa | 0.0 /100 | #281 | Tragic 43.2% |
| Immigrants | Ecuador | 0.0 /100 | #282 | Tragic 43.2% |
| Kiowa | 0.0 /100 | #283 | Tragic 43.2% |
| Immigrants | El Salvador | 0.0 /100 | #284 | Tragic 43.1% |
| Immigrants | Middle Africa | 0.0 /100 | #285 | Tragic 43.0% |
| Ghanaians | 0.0 /100 | #286 | Tragic 42.9% |
| Guatemalans | 0.0 /100 | #287 | Tragic 42.9% |
| Natives/Alaskans | 0.0 /100 | #288 | Tragic 42.8% |