Apache vs Chippewa Currently Married
COMPARE
Apache
Chippewa
Currently Married
Currently Married Comparison
Apache
Chippewa
43.2%
CURRENTLY MARRIED
0.0/ 100
METRIC RATING
280th/ 347
METRIC RANK
43.2%
CURRENTLY MARRIED
0.0/ 100
METRIC RATING
281st/ 347
METRIC RANK
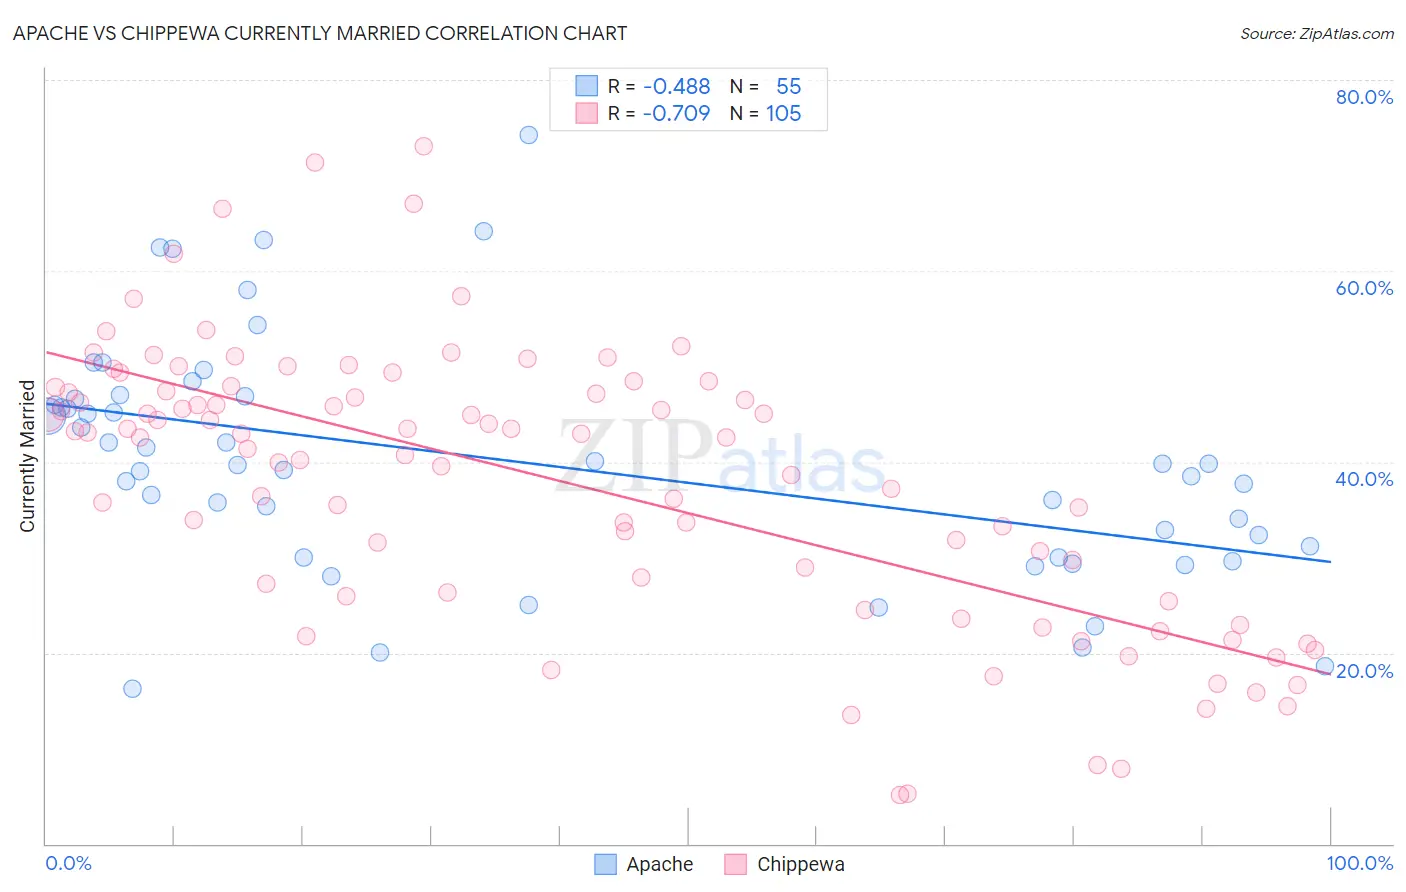
Apache vs Chippewa Currently Married Correlation Chart
The statistical analysis conducted on geographies consisting of 231,125,444 people shows a moderate negative correlation between the proportion of Apache and percentage of population currently married in the United States with a correlation coefficient (R) of -0.488 and weighted average of 43.2%. Similarly, the statistical analysis conducted on geographies consisting of 215,057,083 people shows a strong negative correlation between the proportion of Chippewa and percentage of population currently married in the United States with a correlation coefficient (R) of -0.709 and weighted average of 43.2%, a difference of 0.010%.
Currently Married Correlation Summary
| Measurement | Apache | Chippewa |
| Minimum | 16.3% | 5.1% |
| Maximum | 74.2% | 73.1% |
| Range | 57.9% | 68.0% |
| Mean | 40.0% | 38.0% |
| Median | 39.7% | 42.5% |
| Interquartile 25% (IQ1) | 30.0% | 26.1% |
| Interquartile 75% (IQ3) | 46.7% | 47.6% |
| Interquartile Range (IQR) | 16.7% | 21.5% |
| Standard Deviation (Sample) | 12.3% | 14.5% |
| Standard Deviation (Population) | 12.2% | 14.4% |
Demographics Similar to Apache and Chippewa by Currently Married
In terms of currently married, the demographic groups most similar to Apache are Central American Indian (43.3%, a difference of 0.080%), Immigrants from Ecuador (43.2%, a difference of 0.080%), Kiowa (43.2%, a difference of 0.19%), Immigrants from El Salvador (43.1%, a difference of 0.20%), and Central American (43.3%, a difference of 0.23%). Similarly, the demographic groups most similar to Chippewa are Immigrants from Ecuador (43.2%, a difference of 0.070%), Central American Indian (43.3%, a difference of 0.080%), Kiowa (43.2%, a difference of 0.19%), Immigrants from El Salvador (43.1%, a difference of 0.20%), and Central American (43.3%, a difference of 0.24%).
| Demographics | Rating | Rank | Currently Married |
| Salvadorans | 0.1 /100 | #270 | Tragic 43.5% |
| Bermudans | 0.1 /100 | #271 | Tragic 43.5% |
| Indonesians | 0.1 /100 | #272 | Tragic 43.5% |
| Yaqui | 0.1 /100 | #273 | Tragic 43.4% |
| Nigerians | 0.1 /100 | #274 | Tragic 43.4% |
| Colville | 0.1 /100 | #275 | Tragic 43.4% |
| Sierra Leoneans | 0.1 /100 | #276 | Tragic 43.4% |
| Immigrants | Nigeria | 0.1 /100 | #277 | Tragic 43.4% |
| Central Americans | 0.0 /100 | #278 | Tragic 43.3% |
| Central American Indians | 0.0 /100 | #279 | Tragic 43.3% |
| Apache | 0.0 /100 | #280 | Tragic 43.2% |
| Chippewa | 0.0 /100 | #281 | Tragic 43.2% |
| Immigrants | Ecuador | 0.0 /100 | #282 | Tragic 43.2% |
| Kiowa | 0.0 /100 | #283 | Tragic 43.2% |
| Immigrants | El Salvador | 0.0 /100 | #284 | Tragic 43.1% |
| Immigrants | Middle Africa | 0.0 /100 | #285 | Tragic 43.0% |
| Ghanaians | 0.0 /100 | #286 | Tragic 42.9% |
| Guatemalans | 0.0 /100 | #287 | Tragic 42.9% |
| Natives/Alaskans | 0.0 /100 | #288 | Tragic 42.8% |
| Paiute | 0.0 /100 | #289 | Tragic 42.7% |
| Immigrants | Ghana | 0.0 /100 | #290 | Tragic 42.7% |