Immigrants from Afghanistan vs Chippewa Currently Married
COMPARE
Immigrants from Afghanistan
Chippewa
Currently Married
Currently Married Comparison
Immigrants from Afghanistan
Chippewa
46.8%
CURRENTLY MARRIED
58.2/ 100
METRIC RATING
168th/ 347
METRIC RANK
43.2%
CURRENTLY MARRIED
0.0/ 100
METRIC RATING
281st/ 347
METRIC RANK
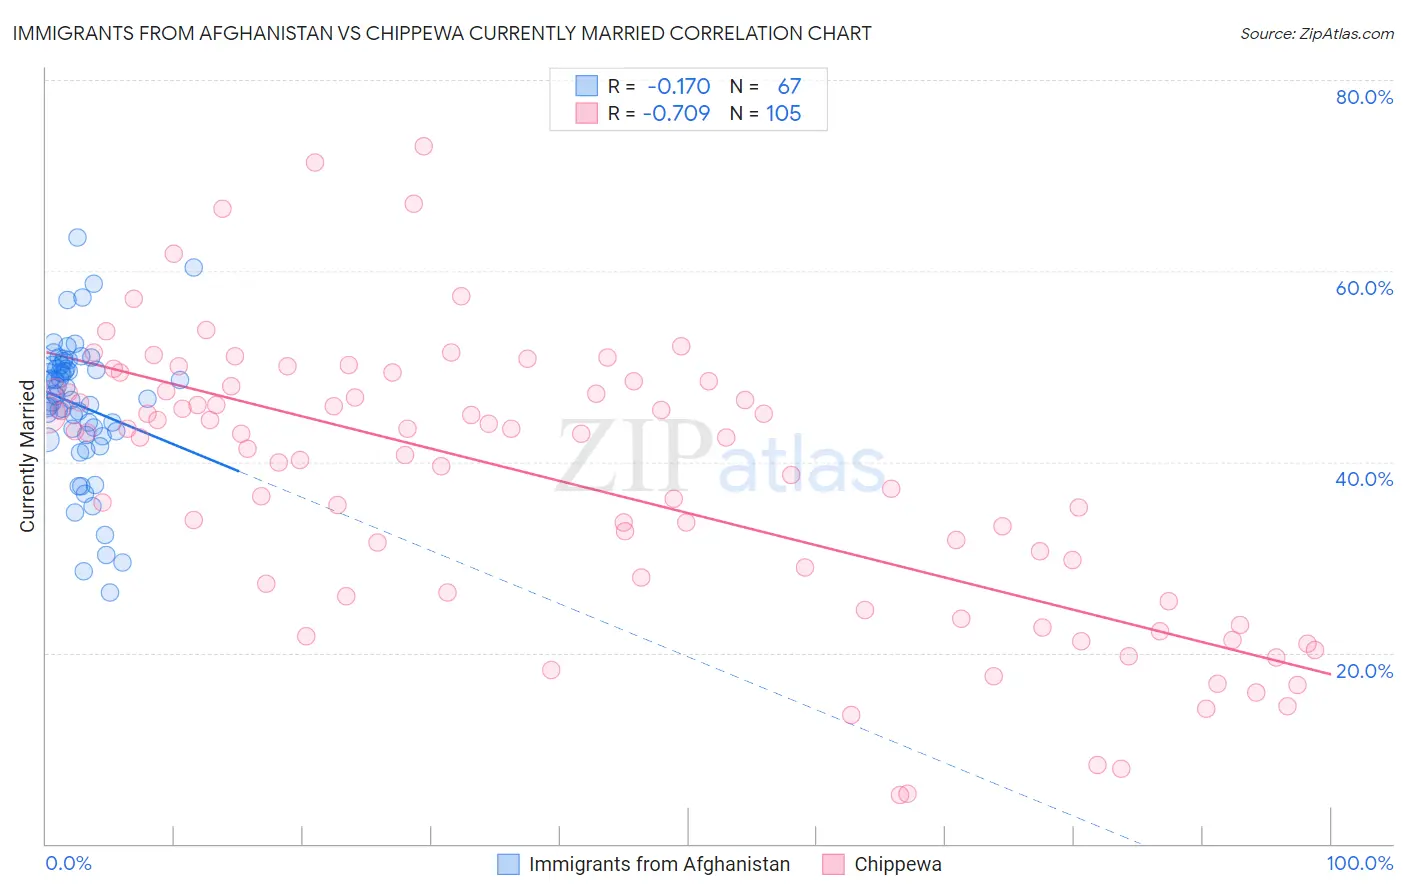
Immigrants from Afghanistan vs Chippewa Currently Married Correlation Chart
The statistical analysis conducted on geographies consisting of 147,642,585 people shows a poor negative correlation between the proportion of Immigrants from Afghanistan and percentage of population currently married in the United States with a correlation coefficient (R) of -0.170 and weighted average of 46.8%. Similarly, the statistical analysis conducted on geographies consisting of 215,057,083 people shows a strong negative correlation between the proportion of Chippewa and percentage of population currently married in the United States with a correlation coefficient (R) of -0.709 and weighted average of 43.2%, a difference of 8.2%.
Currently Married Correlation Summary
| Measurement | Immigrants from Afghanistan | Chippewa |
| Minimum | 26.3% | 5.1% |
| Maximum | 63.5% | 73.1% |
| Range | 37.2% | 68.0% |
| Mean | 46.0% | 38.0% |
| Median | 46.9% | 42.5% |
| Interquartile 25% (IQ1) | 42.8% | 26.1% |
| Interquartile 75% (IQ3) | 50.1% | 47.6% |
| Interquartile Range (IQR) | 7.3% | 21.5% |
| Standard Deviation (Sample) | 7.2% | 14.5% |
| Standard Deviation (Population) | 7.2% | 14.4% |
Similar Demographics by Currently Married
Demographics Similar to Immigrants from Afghanistan by Currently Married
In terms of currently married, the demographic groups most similar to Immigrants from Afghanistan are Armenian (46.8%, a difference of 0.0%), Spaniard (46.8%, a difference of 0.020%), Immigrants from Syria (46.8%, a difference of 0.040%), Samoan (46.8%, a difference of 0.060%), and Immigrants from Latvia (46.7%, a difference of 0.060%).
| Demographics | Rating | Rank | Currently Married |
| Immigrants | Southern Europe | 65.9 /100 | #161 | Good 46.9% |
| Immigrants | Nonimmigrants | 65.4 /100 | #162 | Good 46.9% |
| Delaware | 64.7 /100 | #163 | Good 46.9% |
| Immigrants | Western Asia | 64.2 /100 | #164 | Good 46.9% |
| Samoans | 59.8 /100 | #165 | Average 46.8% |
| Immigrants | Syria | 59.3 /100 | #166 | Average 46.8% |
| Spaniards | 58.8 /100 | #167 | Average 46.8% |
| Immigrants | Afghanistan | 58.2 /100 | #168 | Average 46.8% |
| Armenians | 58.2 /100 | #169 | Average 46.8% |
| Immigrants | Latvia | 56.7 /100 | #170 | Average 46.7% |
| Immigrants | Zimbabwe | 52.4 /100 | #171 | Average 46.7% |
| Aleuts | 52.0 /100 | #172 | Average 46.7% |
| Tlingit-Haida | 51.2 /100 | #173 | Average 46.7% |
| Peruvians | 50.0 /100 | #174 | Average 46.6% |
| Immigrants | Brazil | 49.9 /100 | #175 | Average 46.6% |
Demographics Similar to Chippewa by Currently Married
In terms of currently married, the demographic groups most similar to Chippewa are Apache (43.2%, a difference of 0.010%), Immigrants from Ecuador (43.2%, a difference of 0.070%), Central American Indian (43.3%, a difference of 0.080%), Kiowa (43.2%, a difference of 0.19%), and Immigrants from El Salvador (43.1%, a difference of 0.20%).
| Demographics | Rating | Rank | Currently Married |
| Nigerians | 0.1 /100 | #274 | Tragic 43.4% |
| Colville | 0.1 /100 | #275 | Tragic 43.4% |
| Sierra Leoneans | 0.1 /100 | #276 | Tragic 43.4% |
| Immigrants | Nigeria | 0.1 /100 | #277 | Tragic 43.4% |
| Central Americans | 0.0 /100 | #278 | Tragic 43.3% |
| Central American Indians | 0.0 /100 | #279 | Tragic 43.3% |
| Apache | 0.0 /100 | #280 | Tragic 43.2% |
| Chippewa | 0.0 /100 | #281 | Tragic 43.2% |
| Immigrants | Ecuador | 0.0 /100 | #282 | Tragic 43.2% |
| Kiowa | 0.0 /100 | #283 | Tragic 43.2% |
| Immigrants | El Salvador | 0.0 /100 | #284 | Tragic 43.1% |
| Immigrants | Middle Africa | 0.0 /100 | #285 | Tragic 43.0% |
| Ghanaians | 0.0 /100 | #286 | Tragic 42.9% |
| Guatemalans | 0.0 /100 | #287 | Tragic 42.9% |
| Natives/Alaskans | 0.0 /100 | #288 | Tragic 42.8% |