Panamanian vs Immigrants from Croatia Average Family Size
COMPARE
Panamanian
Immigrants from Croatia
Average Family Size
Average Family Size Comparison
Panamanians
Immigrants from Croatia
3.25
AVERAGE FAMILY SIZE
84.2/ 100
METRIC RATING
135th/ 347
METRIC RANK
3.14
AVERAGE FAMILY SIZE
0.2/ 100
METRIC RATING
294th/ 347
METRIC RANK
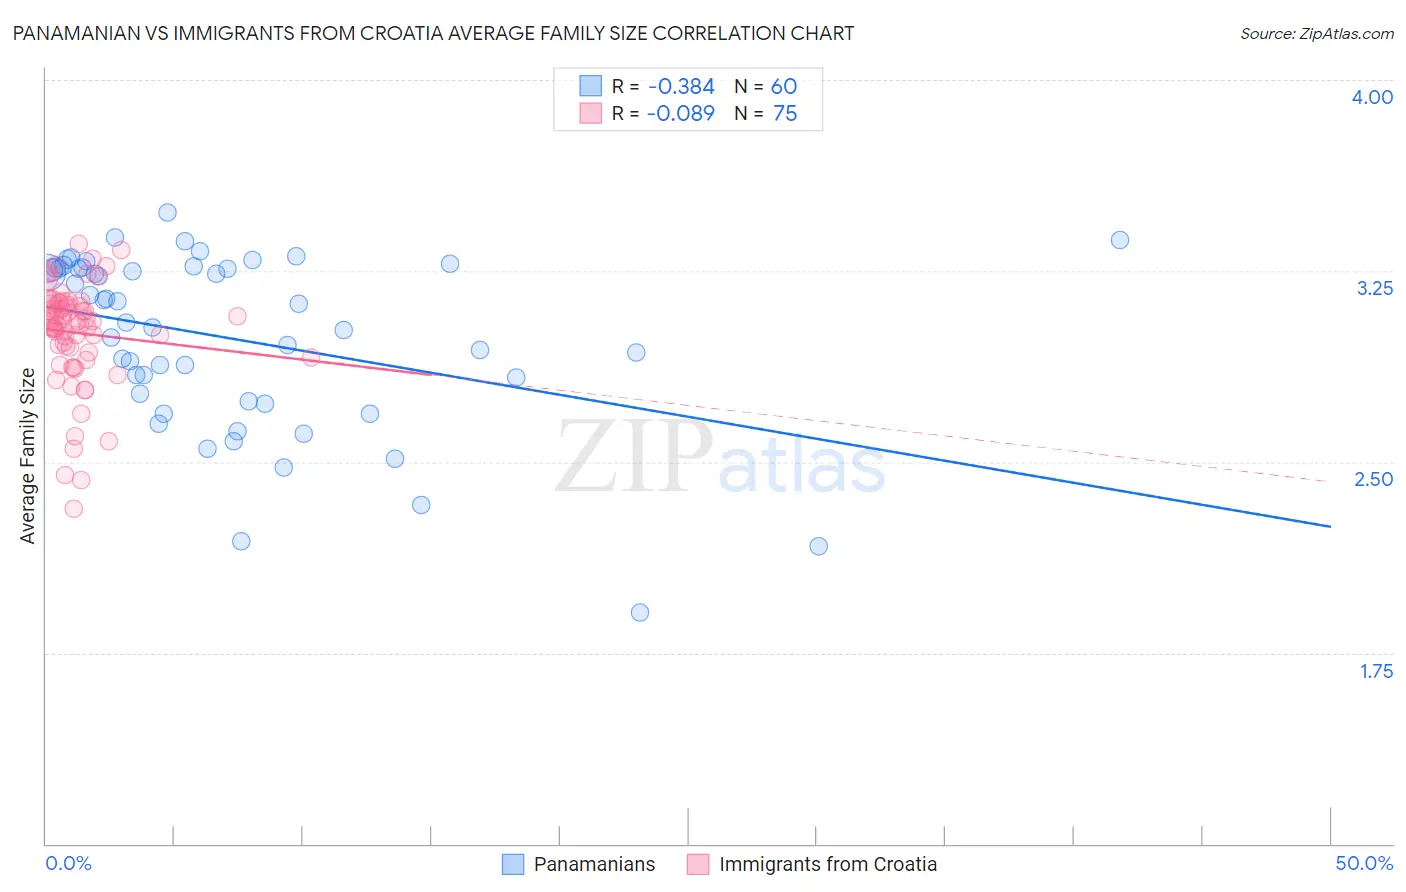
Panamanian vs Immigrants from Croatia Average Family Size Correlation Chart
The statistical analysis conducted on geographies consisting of 281,072,582 people shows a mild negative correlation between the proportion of Panamanians and average family size in the United States with a correlation coefficient (R) of -0.384 and weighted average of 3.25. Similarly, the statistical analysis conducted on geographies consisting of 132,563,359 people shows a slight negative correlation between the proportion of Immigrants from Croatia and average family size in the United States with a correlation coefficient (R) of -0.089 and weighted average of 3.14, a difference of 3.6%.
Average Family Size Correlation Summary
| Measurement | Panamanian | Immigrants from Croatia |
| Minimum | 1.91 | 2.32 |
| Maximum | 3.48 | 3.36 |
| Range | 1.57 | 1.04 |
| Mean | 2.98 | 3.01 |
| Median | 3.08 | 3.05 |
| Interquartile 25% (IQ1) | 2.75 | 2.93 |
| Interquartile 75% (IQ3) | 3.26 | 3.13 |
| Interquartile Range (IQR) | 0.51 | 0.20 |
| Standard Deviation (Sample) | 0.35 | 0.20 |
| Standard Deviation (Population) | 0.34 | 0.20 |
Similar Demographics by Average Family Size
Demographics Similar to Panamanians by Average Family Size
In terms of average family size, the demographic groups most similar to Panamanians are African (3.25, a difference of 0.020%), Comanche (3.25, a difference of 0.050%), Immigrants from Middle Africa (3.25, a difference of 0.060%), Immigrants from Venezuela (3.26, a difference of 0.070%), and Cuban (3.25, a difference of 0.080%).
| Demographics | Rating | Rank | Average Family Size |
| Colombians | 89.9 /100 | #128 | Excellent 3.26 |
| Immigrants | Hong Kong | 88.6 /100 | #129 | Excellent 3.26 |
| Laotians | 88.5 /100 | #130 | Excellent 3.26 |
| Immigrants | Western Asia | 87.7 /100 | #131 | Excellent 3.26 |
| Costa Ricans | 86.8 /100 | #132 | Excellent 3.26 |
| Immigrants | Venezuela | 86.3 /100 | #133 | Excellent 3.26 |
| Africans | 84.9 /100 | #134 | Excellent 3.25 |
| Panamanians | 84.2 /100 | #135 | Excellent 3.25 |
| Comanche | 82.8 /100 | #136 | Excellent 3.25 |
| Immigrants | Middle Africa | 82.4 /100 | #137 | Excellent 3.25 |
| Cubans | 81.8 /100 | #138 | Excellent 3.25 |
| Immigrants | Ethiopia | 81.6 /100 | #139 | Excellent 3.25 |
| Sub-Saharan Africans | 81.6 /100 | #140 | Excellent 3.25 |
| Venezuelans | 81.4 /100 | #141 | Excellent 3.25 |
| Liberians | 81.2 /100 | #142 | Excellent 3.25 |
Demographics Similar to Immigrants from Croatia by Average Family Size
In terms of average family size, the demographic groups most similar to Immigrants from Croatia are Austrian (3.14, a difference of 0.010%), Ukrainian (3.14, a difference of 0.010%), Immigrants from Western Europe (3.14, a difference of 0.010%), Colville (3.14, a difference of 0.010%), and Scandinavian (3.14, a difference of 0.020%).
| Demographics | Rating | Rank | Average Family Size |
| Greeks | 0.3 /100 | #287 | Tragic 3.14 |
| Immigrants | Czechoslovakia | 0.3 /100 | #288 | Tragic 3.14 |
| Immigrants | Norway | 0.3 /100 | #289 | Tragic 3.14 |
| Cypriots | 0.3 /100 | #290 | Tragic 3.14 |
| Alsatians | 0.2 /100 | #291 | Tragic 3.14 |
| Europeans | 0.2 /100 | #292 | Tragic 3.14 |
| Scandinavians | 0.2 /100 | #293 | Tragic 3.14 |
| Immigrants | Croatia | 0.2 /100 | #294 | Tragic 3.14 |
| Austrians | 0.2 /100 | #295 | Tragic 3.14 |
| Ukrainians | 0.2 /100 | #296 | Tragic 3.14 |
| Immigrants | Western Europe | 0.2 /100 | #297 | Tragic 3.14 |
| Colville | 0.2 /100 | #298 | Tragic 3.14 |
| Canadians | 0.2 /100 | #299 | Tragic 3.14 |
| Immigrants | Sweden | 0.2 /100 | #300 | Tragic 3.14 |
| Macedonians | 0.2 /100 | #301 | Tragic 3.13 |