Panamanian vs Danish Average Family Size
COMPARE
Panamanian
Danish
Average Family Size
Average Family Size Comparison
Panamanians
Danes
3.25
AVERAGE FAMILY SIZE
84.2/ 100
METRIC RATING
135th/ 347
METRIC RANK
3.17
AVERAGE FAMILY SIZE
2.5/ 100
METRIC RATING
246th/ 347
METRIC RANK
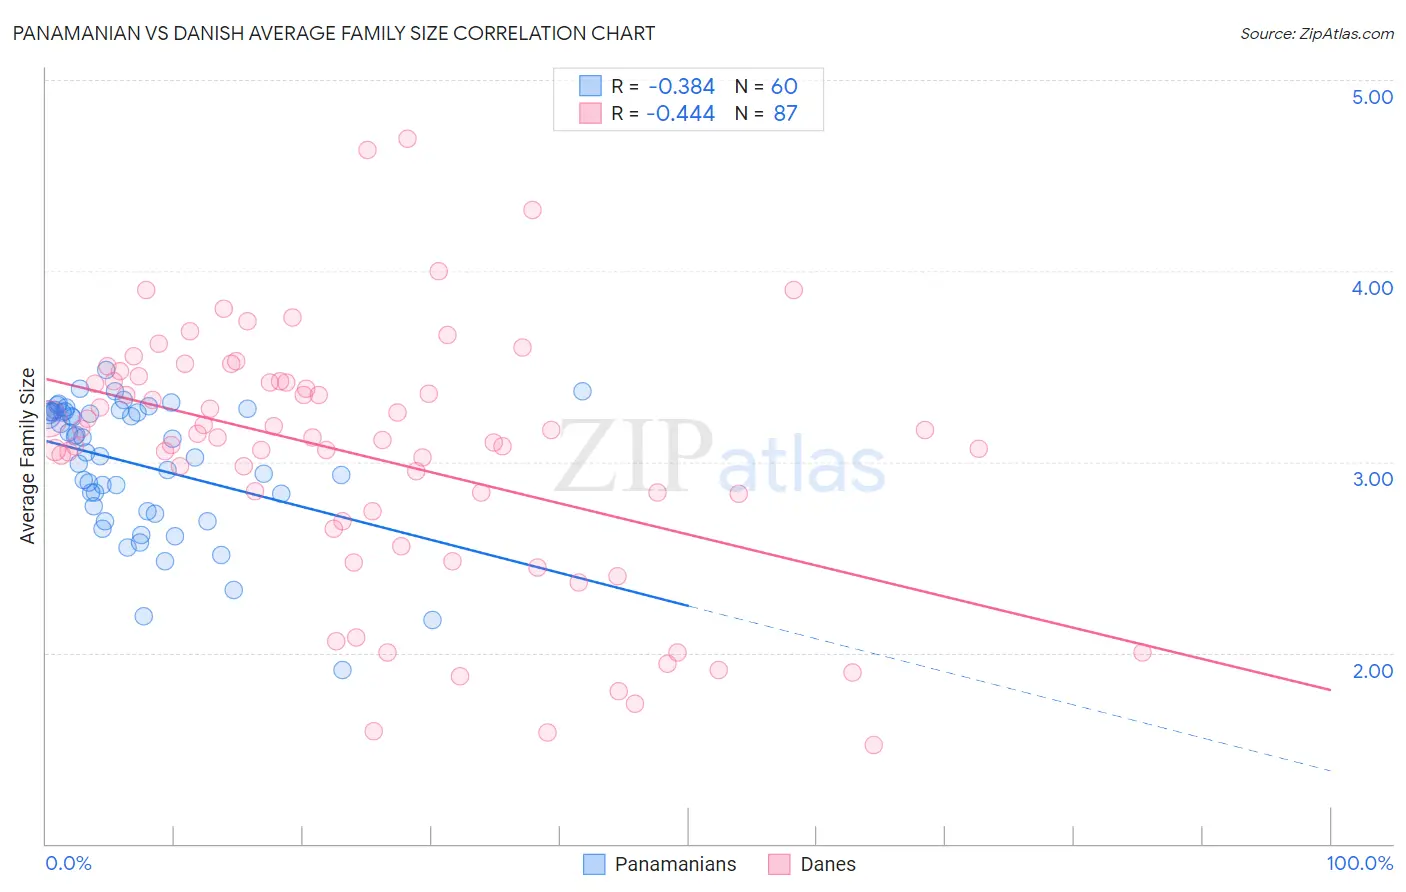
Panamanian vs Danish Average Family Size Correlation Chart
The statistical analysis conducted on geographies consisting of 281,072,582 people shows a mild negative correlation between the proportion of Panamanians and average family size in the United States with a correlation coefficient (R) of -0.384 and weighted average of 3.25. Similarly, the statistical analysis conducted on geographies consisting of 473,910,461 people shows a moderate negative correlation between the proportion of Danes and average family size in the United States with a correlation coefficient (R) of -0.444 and weighted average of 3.17, a difference of 2.5%.
Average Family Size Correlation Summary
| Measurement | Panamanian | Danish |
| Minimum | 1.91 | 1.52 |
| Maximum | 3.48 | 4.69 |
| Range | 1.57 | 3.17 |
| Mean | 2.98 | 3.03 |
| Median | 3.08 | 3.12 |
| Interquartile 25% (IQ1) | 2.75 | 2.69 |
| Interquartile 75% (IQ3) | 3.26 | 3.42 |
| Interquartile Range (IQR) | 0.51 | 0.73 |
| Standard Deviation (Sample) | 0.35 | 0.67 |
| Standard Deviation (Population) | 0.34 | 0.66 |
Similar Demographics by Average Family Size
Demographics Similar to Panamanians by Average Family Size
In terms of average family size, the demographic groups most similar to Panamanians are African (3.25, a difference of 0.020%), Comanche (3.25, a difference of 0.050%), Immigrants from Middle Africa (3.25, a difference of 0.060%), Immigrants from Venezuela (3.26, a difference of 0.070%), and Cuban (3.25, a difference of 0.080%).
| Demographics | Rating | Rank | Average Family Size |
| Colombians | 89.9 /100 | #128 | Excellent 3.26 |
| Immigrants | Hong Kong | 88.6 /100 | #129 | Excellent 3.26 |
| Laotians | 88.5 /100 | #130 | Excellent 3.26 |
| Immigrants | Western Asia | 87.7 /100 | #131 | Excellent 3.26 |
| Costa Ricans | 86.8 /100 | #132 | Excellent 3.26 |
| Immigrants | Venezuela | 86.3 /100 | #133 | Excellent 3.26 |
| Africans | 84.9 /100 | #134 | Excellent 3.25 |
| Panamanians | 84.2 /100 | #135 | Excellent 3.25 |
| Comanche | 82.8 /100 | #136 | Excellent 3.25 |
| Immigrants | Middle Africa | 82.4 /100 | #137 | Excellent 3.25 |
| Cubans | 81.8 /100 | #138 | Excellent 3.25 |
| Immigrants | Ethiopia | 81.6 /100 | #139 | Excellent 3.25 |
| Sub-Saharan Africans | 81.6 /100 | #140 | Excellent 3.25 |
| Venezuelans | 81.4 /100 | #141 | Excellent 3.25 |
| Liberians | 81.2 /100 | #142 | Excellent 3.25 |
Demographics Similar to Danes by Average Family Size
In terms of average family size, the demographic groups most similar to Danes are Cajun (3.17, a difference of 0.010%), Immigrants from Brazil (3.18, a difference of 0.040%), Immigrants from Belarus (3.17, a difference of 0.040%), Immigrants from Southern Europe (3.18, a difference of 0.070%), and Hungarian (3.18, a difference of 0.080%).
| Demographics | Rating | Rank | Average Family Size |
| Houma | 3.4 /100 | #239 | Tragic 3.18 |
| Osage | 3.2 /100 | #240 | Tragic 3.18 |
| Immigrants | Japan | 3.0 /100 | #241 | Tragic 3.18 |
| Hungarians | 3.0 /100 | #242 | Tragic 3.18 |
| Immigrants | Moldova | 2.9 /100 | #243 | Tragic 3.18 |
| Immigrants | Southern Europe | 2.9 /100 | #244 | Tragic 3.18 |
| Immigrants | Brazil | 2.7 /100 | #245 | Tragic 3.18 |
| Danes | 2.5 /100 | #246 | Tragic 3.17 |
| Cajuns | 2.4 /100 | #247 | Tragic 3.17 |
| Immigrants | Belarus | 2.3 /100 | #248 | Tragic 3.17 |
| Immigrants | Eastern Europe | 2.1 /100 | #249 | Tragic 3.17 |
| Puget Sound Salish | 1.9 /100 | #250 | Tragic 3.17 |
| Immigrants | Spain | 1.8 /100 | #251 | Tragic 3.17 |
| Immigrants | Saudi Arabia | 1.7 /100 | #252 | Tragic 3.17 |
| South Africans | 1.7 /100 | #253 | Tragic 3.17 |