Panamanian vs Immigrants from Burma/Myanmar In Labor Force | Age 45-54
COMPARE
Panamanian
Immigrants from Burma/Myanmar
In Labor Force | Age 45-54
In Labor Force | Age 45-54 Comparison
Panamanians
Immigrants from Burma/Myanmar
82.2%
IN LABOR FORCE | AGE 45-54
3.5/ 100
METRIC RATING
221st/ 347
METRIC RANK
82.0%
IN LABOR FORCE | AGE 45-54
1.9/ 100
METRIC RATING
229th/ 347
METRIC RANK
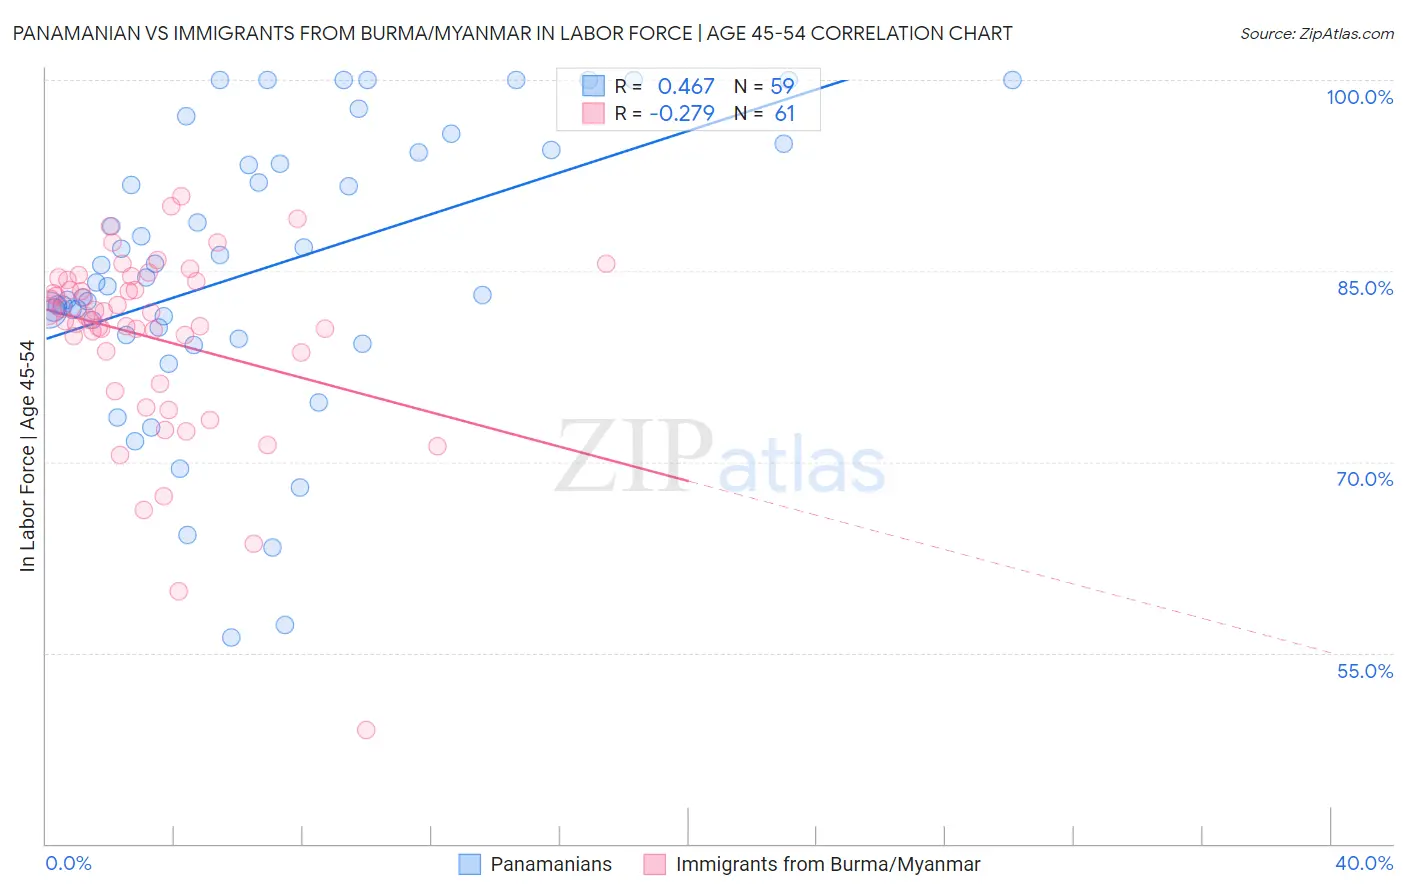
Panamanian vs Immigrants from Burma/Myanmar In Labor Force | Age 45-54 Correlation Chart
The statistical analysis conducted on geographies consisting of 281,072,319 people shows a moderate positive correlation between the proportion of Panamanians and labor force participation rate among population between the ages 45 and 54 in the United States with a correlation coefficient (R) of 0.467 and weighted average of 82.2%. Similarly, the statistical analysis conducted on geographies consisting of 172,276,017 people shows a weak negative correlation between the proportion of Immigrants from Burma/Myanmar and labor force participation rate among population between the ages 45 and 54 in the United States with a correlation coefficient (R) of -0.279 and weighted average of 82.0%, a difference of 0.14%.
In Labor Force | Age 45-54 Correlation Summary
| Measurement | Panamanian | Immigrants from Burma/Myanmar |
| Minimum | 56.2% | 48.9% |
| Maximum | 100.0% | 90.9% |
| Range | 43.8% | 42.0% |
| Mean | 85.1% | 79.7% |
| Median | 84.1% | 81.5% |
| Interquartile 25% (IQ1) | 79.9% | 77.4% |
| Interquartile 75% (IQ3) | 94.3% | 84.3% |
| Interquartile Range (IQR) | 14.4% | 6.9% |
| Standard Deviation (Sample) | 10.9% | 7.5% |
| Standard Deviation (Population) | 10.8% | 7.4% |
Demographics Similar to Panamanians and Immigrants from Burma/Myanmar by In Labor Force | Age 45-54
In terms of in labor force | age 45-54, the demographic groups most similar to Panamanians are Immigrants from Ecuador (82.2%, a difference of 0.0%), Bahamian (82.2%, a difference of 0.010%), Immigrants (82.1%, a difference of 0.020%), French (82.2%, a difference of 0.040%), and English (82.2%, a difference of 0.050%). Similarly, the demographic groups most similar to Immigrants from Burma/Myanmar are Jamaican (82.0%, a difference of 0.010%), Cape Verdean (82.1%, a difference of 0.020%), Immigrants from Senegal (82.0%, a difference of 0.030%), Immigrants from Portugal (82.0%, a difference of 0.030%), and Malaysian (82.0%, a difference of 0.030%).
| Demographics | Rating | Rank | In Labor Force | Age 45-54 |
| Iraqis | 5.6 /100 | #215 | Tragic 82.2% |
| Scottish | 5.3 /100 | #216 | Tragic 82.2% |
| Portuguese | 4.7 /100 | #217 | Tragic 82.2% |
| English | 4.4 /100 | #218 | Tragic 82.2% |
| French | 4.1 /100 | #219 | Tragic 82.2% |
| Bahamians | 3.6 /100 | #220 | Tragic 82.2% |
| Panamanians | 3.5 /100 | #221 | Tragic 82.2% |
| Immigrants | Ecuador | 3.4 /100 | #222 | Tragic 82.2% |
| Immigrants | Immigrants | 3.1 /100 | #223 | Tragic 82.1% |
| Immigrants | Jamaica | 2.7 /100 | #224 | Tragic 82.1% |
| Immigrants | Oceania | 2.5 /100 | #225 | Tragic 82.1% |
| Immigrants | Caribbean | 2.5 /100 | #226 | Tragic 82.1% |
| Immigrants | Germany | 2.4 /100 | #227 | Tragic 82.1% |
| Cape Verdeans | 2.1 /100 | #228 | Tragic 82.1% |
| Immigrants | Burma/Myanmar | 1.9 /100 | #229 | Tragic 82.0% |
| Jamaicans | 1.8 /100 | #230 | Tragic 82.0% |
| Immigrants | Senegal | 1.7 /100 | #231 | Tragic 82.0% |
| Immigrants | Portugal | 1.7 /100 | #232 | Tragic 82.0% |
| Malaysians | 1.7 /100 | #233 | Tragic 82.0% |
| Salvadorans | 1.7 /100 | #234 | Tragic 82.0% |
| Sub-Saharan Africans | 1.2 /100 | #235 | Tragic 82.0% |