Panamanian vs Immigrants from Asia Average Family Size
COMPARE
Panamanian
Immigrants from Asia
Average Family Size
Average Family Size Comparison
Panamanians
Immigrants from Asia
3.25
AVERAGE FAMILY SIZE
84.2/ 100
METRIC RATING
135th/ 347
METRIC RANK
3.27
AVERAGE FAMILY SIZE
94.0/ 100
METRIC RATING
118th/ 347
METRIC RANK
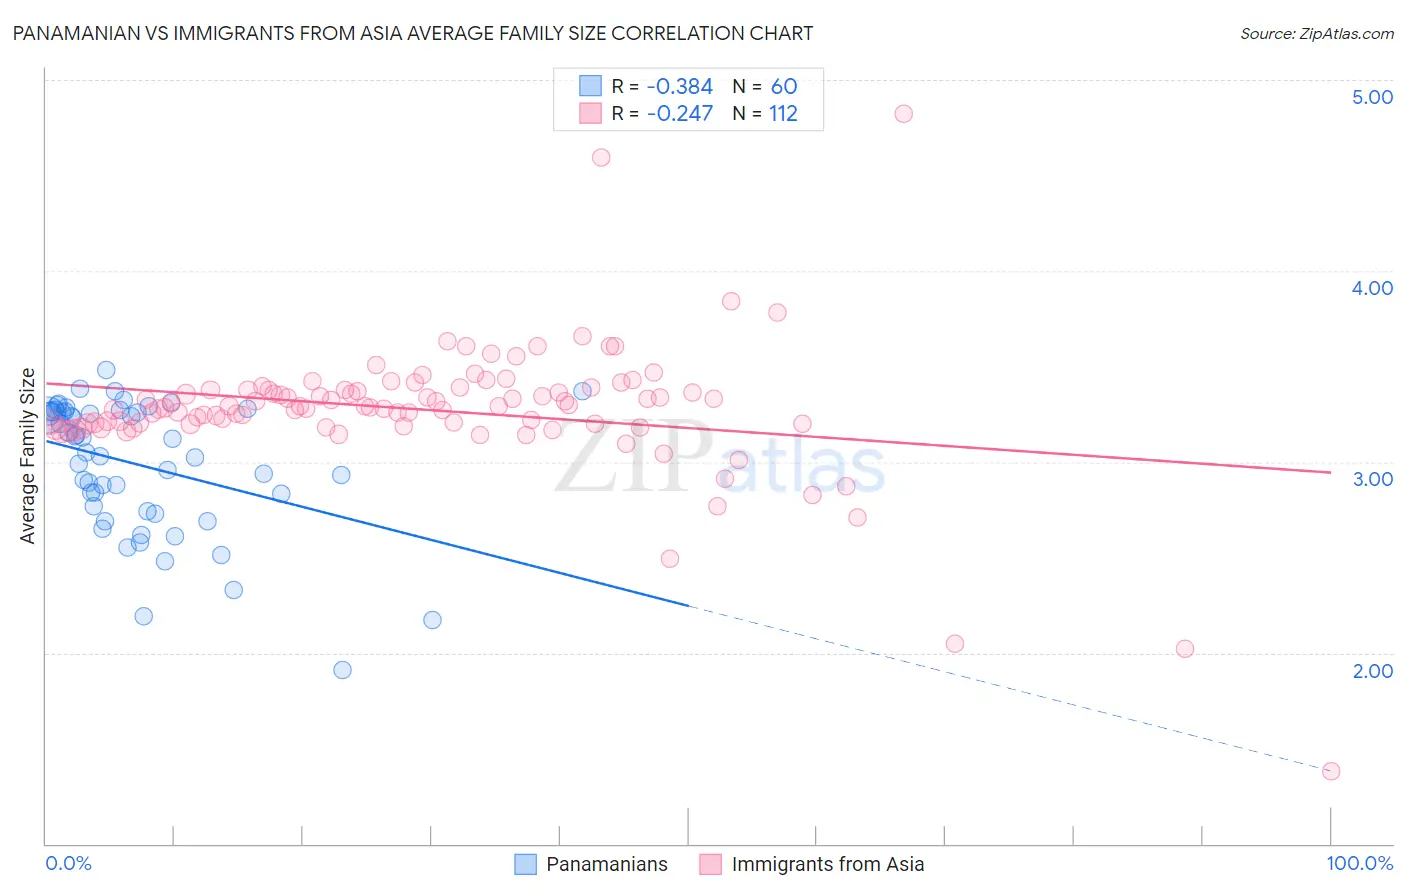
Panamanian vs Immigrants from Asia Average Family Size Correlation Chart
The statistical analysis conducted on geographies consisting of 281,072,582 people shows a mild negative correlation between the proportion of Panamanians and average family size in the United States with a correlation coefficient (R) of -0.384 and weighted average of 3.25. Similarly, the statistical analysis conducted on geographies consisting of 548,543,800 people shows a weak negative correlation between the proportion of Immigrants from Asia and average family size in the United States with a correlation coefficient (R) of -0.247 and weighted average of 3.27, a difference of 0.48%.
Average Family Size Correlation Summary
| Measurement | Panamanian | Immigrants from Asia |
| Minimum | 1.91 | 1.38 |
| Maximum | 3.48 | 4.82 |
| Range | 1.57 | 3.44 |
| Mean | 2.98 | 3.27 |
| Median | 3.08 | 3.29 |
| Interquartile 25% (IQ1) | 2.75 | 3.20 |
| Interquartile 75% (IQ3) | 3.26 | 3.38 |
| Interquartile Range (IQR) | 0.51 | 0.18 |
| Standard Deviation (Sample) | 0.35 | 0.37 |
| Standard Deviation (Population) | 0.34 | 0.36 |
Demographics Similar to Panamanians and Immigrants from Asia by Average Family Size
In terms of average family size, the demographic groups most similar to Panamanians are African (3.25, a difference of 0.020%), Comanche (3.25, a difference of 0.050%), Immigrants from Venezuela (3.26, a difference of 0.070%), Costa Rican (3.26, a difference of 0.090%), and Immigrants from Western Asia (3.26, a difference of 0.13%). Similarly, the demographic groups most similar to Immigrants from Asia are Immigrants from Indonesia (3.27, a difference of 0.020%), Immigrants from Bahamas (3.27, a difference of 0.030%), Immigrants from Thailand (3.27, a difference of 0.050%), Kiowa (3.27, a difference of 0.070%), and Immigrants from South America (3.27, a difference of 0.090%).
| Demographics | Rating | Rank | Average Family Size |
| Immigrants | South America | 95.0 /100 | #116 | Exceptional 3.27 |
| Kiowa | 94.8 /100 | #117 | Exceptional 3.27 |
| Immigrants | Asia | 94.0 /100 | #118 | Exceptional 3.27 |
| Immigrants | Indonesia | 93.7 /100 | #119 | Exceptional 3.27 |
| Immigrants | Bahamas | 93.6 /100 | #120 | Exceptional 3.27 |
| Immigrants | Thailand | 93.3 /100 | #121 | Exceptional 3.27 |
| Immigrants | Colombia | 92.8 /100 | #122 | Exceptional 3.27 |
| Alaskan Athabascans | 92.4 /100 | #123 | Exceptional 3.27 |
| South American Indians | 91.6 /100 | #124 | Exceptional 3.26 |
| Immigrants | Cuba | 91.3 /100 | #125 | Exceptional 3.26 |
| Immigrants | Costa Rica | 90.7 /100 | #126 | Exceptional 3.26 |
| Immigrants | Syria | 90.6 /100 | #127 | Exceptional 3.26 |
| Colombians | 89.9 /100 | #128 | Excellent 3.26 |
| Immigrants | Hong Kong | 88.6 /100 | #129 | Excellent 3.26 |
| Laotians | 88.5 /100 | #130 | Excellent 3.26 |
| Immigrants | Western Asia | 87.7 /100 | #131 | Excellent 3.26 |
| Costa Ricans | 86.8 /100 | #132 | Excellent 3.26 |
| Immigrants | Venezuela | 86.3 /100 | #133 | Excellent 3.26 |
| Africans | 84.9 /100 | #134 | Excellent 3.25 |
| Panamanians | 84.2 /100 | #135 | Excellent 3.25 |
| Comanche | 82.8 /100 | #136 | Excellent 3.25 |