Panamanian vs Indian (Asian) Average Family Size
COMPARE
Panamanian
Indian (Asian)
Average Family Size
Average Family Size Comparison
Panamanians
Indians (Asian)
3.25
AVERAGE FAMILY SIZE
84.2/ 100
METRIC RATING
135th/ 347
METRIC RANK
3.24
AVERAGE FAMILY SIZE
73.6/ 100
METRIC RATING
150th/ 347
METRIC RANK
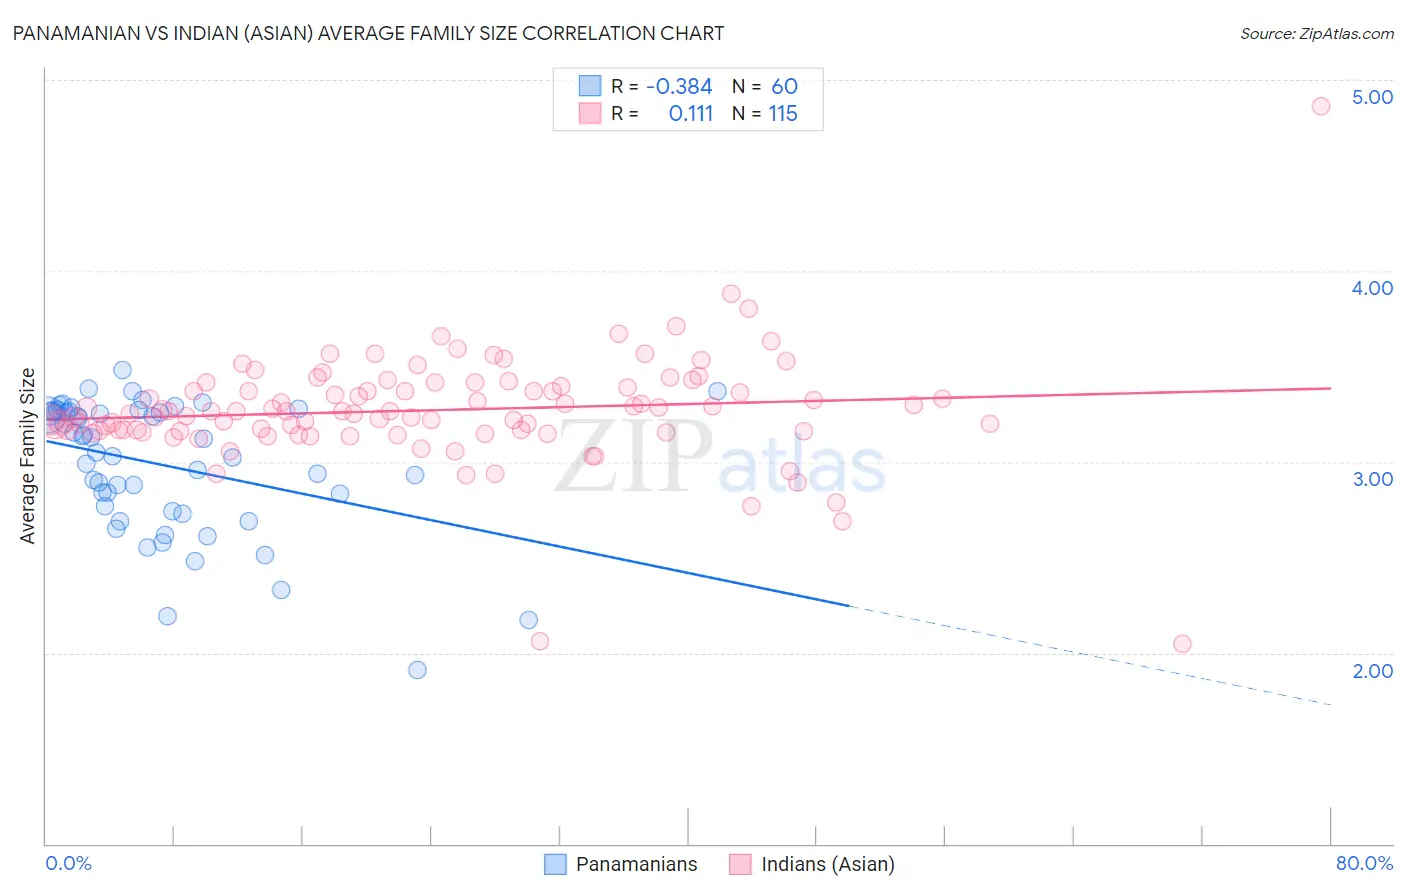
Panamanian vs Indian (Asian) Average Family Size Correlation Chart
The statistical analysis conducted on geographies consisting of 281,072,582 people shows a mild negative correlation between the proportion of Panamanians and average family size in the United States with a correlation coefficient (R) of -0.384 and weighted average of 3.25. Similarly, the statistical analysis conducted on geographies consisting of 494,783,679 people shows a poor positive correlation between the proportion of Indians (Asian) and average family size in the United States with a correlation coefficient (R) of 0.111 and weighted average of 3.24, a difference of 0.29%.
Average Family Size Correlation Summary
| Measurement | Panamanian | Indian (Asian) |
| Minimum | 1.91 | 2.05 |
| Maximum | 3.48 | 4.86 |
| Range | 1.57 | 2.81 |
| Mean | 2.98 | 3.27 |
| Median | 3.08 | 3.26 |
| Interquartile 25% (IQ1) | 2.75 | 3.16 |
| Interquartile 75% (IQ3) | 3.26 | 3.40 |
| Interquartile Range (IQR) | 0.51 | 0.24 |
| Standard Deviation (Sample) | 0.35 | 0.30 |
| Standard Deviation (Population) | 0.34 | 0.29 |
Demographics Similar to Panamanians and Indians (Asian) by Average Family Size
In terms of average family size, the demographic groups most similar to Panamanians are African (3.25, a difference of 0.020%), Comanche (3.25, a difference of 0.050%), Immigrants from Middle Africa (3.25, a difference of 0.060%), Immigrants from Venezuela (3.26, a difference of 0.070%), and Cuban (3.25, a difference of 0.080%). Similarly, the demographic groups most similar to Indians (Asian) are Assyrian/Chaldean/Syriac (3.24, a difference of 0.0%), Jordanian (3.24, a difference of 0.0%), Blackfeet (3.24, a difference of 0.030%), Spanish American (3.24, a difference of 0.030%), and Immigrants from Jordan (3.24, a difference of 0.050%).
| Demographics | Rating | Rank | Average Family Size |
| Costa Ricans | 86.8 /100 | #132 | Excellent 3.26 |
| Immigrants | Venezuela | 86.3 /100 | #133 | Excellent 3.26 |
| Africans | 84.9 /100 | #134 | Excellent 3.25 |
| Panamanians | 84.2 /100 | #135 | Excellent 3.25 |
| Comanche | 82.8 /100 | #136 | Excellent 3.25 |
| Immigrants | Middle Africa | 82.4 /100 | #137 | Excellent 3.25 |
| Cubans | 81.8 /100 | #138 | Excellent 3.25 |
| Immigrants | Ethiopia | 81.6 /100 | #139 | Excellent 3.25 |
| Sub-Saharan Africans | 81.6 /100 | #140 | Excellent 3.25 |
| Venezuelans | 81.4 /100 | #141 | Excellent 3.25 |
| Liberians | 81.2 /100 | #142 | Excellent 3.25 |
| Bhutanese | 81.0 /100 | #143 | Excellent 3.25 |
| Tsimshian | 80.2 /100 | #144 | Excellent 3.25 |
| Armenians | 78.2 /100 | #145 | Good 3.25 |
| Immigrants | Africa | 77.9 /100 | #146 | Good 3.25 |
| Immigrants | Jordan | 75.7 /100 | #147 | Good 3.24 |
| Blackfeet | 75.0 /100 | #148 | Good 3.24 |
| Assyrians/Chaldeans/Syriacs | 73.8 /100 | #149 | Good 3.24 |
| Indians (Asian) | 73.6 /100 | #150 | Good 3.24 |
| Jordanians | 73.5 /100 | #151 | Good 3.24 |
| Spanish Americans | 72.5 /100 | #152 | Good 3.24 |