Ottawa vs Puget Sound Salish Unemployment Among Women with Children Ages 6 to 17 years
COMPARE
Ottawa
Puget Sound Salish
Unemployment Among Women with Children Ages 6 to 17 years
Unemployment Among Women with Children Ages 6 to 17 years Comparison
Ottawa
Puget Sound Salish
10.9%
UNEMPLOYMENT AMONG WOMEN WITH CHILDREN AGES 6 TO 17 YEARS
0.0/ 100
METRIC RATING
328th/ 347
METRIC RANK
7.5%
UNEMPLOYMENT AMONG WOMEN WITH CHILDREN AGES 6 TO 17 YEARS
100.0/ 100
METRIC RATING
15th/ 347
METRIC RANK
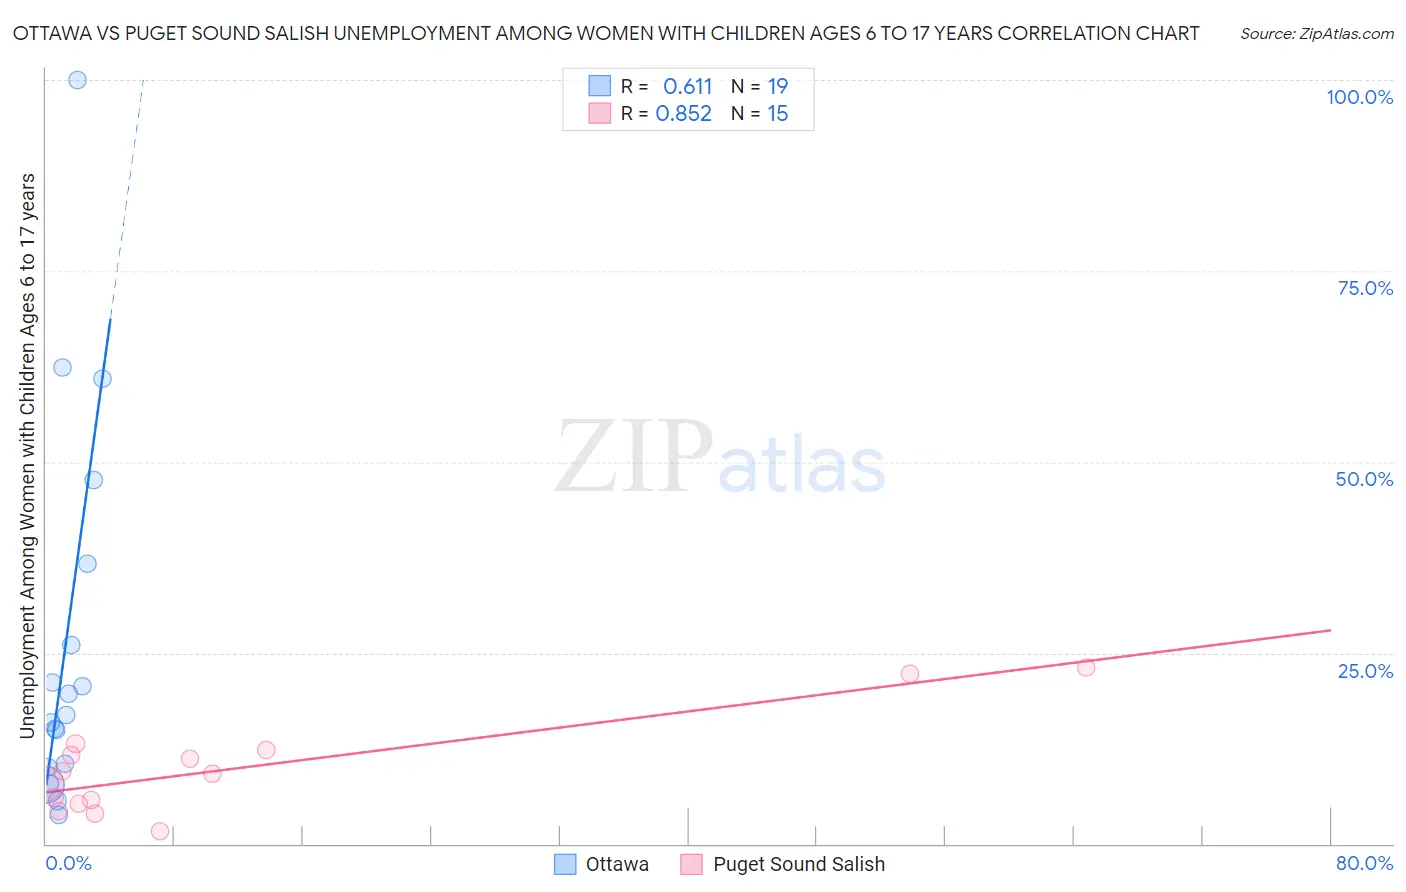
Ottawa vs Puget Sound Salish Unemployment Among Women with Children Ages 6 to 17 years Correlation Chart
The statistical analysis conducted on geographies consisting of 42,886,423 people shows a significant positive correlation between the proportion of Ottawa and unemployment rate among women with children between the ages 6 and 17 in the United States with a correlation coefficient (R) of 0.611 and weighted average of 10.9%. Similarly, the statistical analysis conducted on geographies consisting of 40,323,487 people shows a very strong positive correlation between the proportion of Puget Sound Salish and unemployment rate among women with children between the ages 6 and 17 in the United States with a correlation coefficient (R) of 0.852 and weighted average of 7.5%, a difference of 45.2%.
Unemployment Among Women with Children Ages 6 to 17 years Correlation Summary
| Measurement | Ottawa | Puget Sound Salish |
| Minimum | 3.7% | 1.7% |
| Maximum | 100.0% | 23.1% |
| Range | 96.3% | 21.4% |
| Mean | 26.5% | 9.8% |
| Median | 16.8% | 9.1% |
| Interquartile 25% (IQ1) | 10.0% | 5.2% |
| Interquartile 75% (IQ3) | 36.6% | 12.2% |
| Interquartile Range (IQR) | 26.6% | 7.0% |
| Standard Deviation (Sample) | 24.9% | 6.2% |
| Standard Deviation (Population) | 24.3% | 6.0% |
Similar Demographics by Unemployment Among Women with Children Ages 6 to 17 years
Demographics Similar to Ottawa by Unemployment Among Women with Children Ages 6 to 17 years
In terms of unemployment among women with children ages 6 to 17 years, the demographic groups most similar to Ottawa are Cape Verdean (10.9%, a difference of 0.14%), Liberian (10.8%, a difference of 0.20%), Cajun (10.8%, a difference of 0.27%), Immigrants from Dominican Republic (10.8%, a difference of 0.46%), and Dominican (10.8%, a difference of 0.52%).
| Demographics | Rating | Rank | Unemployment Among Women with Children Ages 6 to 17 years |
| Tohono O'odham | 0.0 /100 | #321 | Tragic 10.7% |
| Cree | 0.0 /100 | #322 | Tragic 10.8% |
| Dominicans | 0.0 /100 | #323 | Tragic 10.8% |
| Immigrants | Dominican Republic | 0.0 /100 | #324 | Tragic 10.8% |
| Cajuns | 0.0 /100 | #325 | Tragic 10.8% |
| Liberians | 0.0 /100 | #326 | Tragic 10.8% |
| Cape Verdeans | 0.0 /100 | #327 | Tragic 10.9% |
| Ottawa | 0.0 /100 | #328 | Tragic 10.9% |
| Pennsylvania Germans | 0.0 /100 | #329 | Tragic 11.0% |
| Chippewa | 0.0 /100 | #330 | Tragic 11.1% |
| Blacks/African Americans | 0.0 /100 | #331 | Tragic 11.4% |
| Tsimshian | 0.0 /100 | #332 | Tragic 11.4% |
| Natives/Alaskans | 0.0 /100 | #333 | Tragic 11.5% |
| Ugandans | 0.0 /100 | #334 | Tragic 12.0% |
| Colville | 0.0 /100 | #335 | Tragic 12.3% |
Demographics Similar to Puget Sound Salish by Unemployment Among Women with Children Ages 6 to 17 years
In terms of unemployment among women with children ages 6 to 17 years, the demographic groups most similar to Puget Sound Salish are Immigrants from Burma/Myanmar (7.5%, a difference of 0.36%), Cambodian (7.5%, a difference of 0.54%), Sudanese (7.4%, a difference of 1.1%), Indonesian (7.4%, a difference of 1.1%), and Afghan (7.6%, a difference of 1.2%).
| Demographics | Rating | Rank | Unemployment Among Women with Children Ages 6 to 17 years |
| Immigrants | Hong Kong | 100.0 /100 | #8 | Exceptional 7.2% |
| Assyrians/Chaldeans/Syriacs | 100.0 /100 | #9 | Exceptional 7.2% |
| Immigrants | Fiji | 100.0 /100 | #10 | Exceptional 7.3% |
| Immigrants | Taiwan | 100.0 /100 | #11 | Exceptional 7.3% |
| Bangladeshis | 100.0 /100 | #12 | Exceptional 7.4% |
| Indonesians | 100.0 /100 | #13 | Exceptional 7.4% |
| Sudanese | 100.0 /100 | #14 | Exceptional 7.4% |
| Puget Sound Salish | 100.0 /100 | #15 | Exceptional 7.5% |
| Immigrants | Burma/Myanmar | 100.0 /100 | #16 | Exceptional 7.5% |
| Cambodians | 100.0 /100 | #17 | Exceptional 7.5% |
| Afghans | 100.0 /100 | #18 | Exceptional 7.6% |
| Filipinos | 100.0 /100 | #19 | Exceptional 7.6% |
| Immigrants | Singapore | 100.0 /100 | #20 | Exceptional 7.7% |
| Immigrants | India | 100.0 /100 | #21 | Exceptional 7.7% |
| Immigrants | China | 100.0 /100 | #22 | Exceptional 7.7% |