Norwegian vs Cuban Single Mother Households
COMPARE
Norwegian
Cuban
Single Mother Households
Single Mother Households Comparison
Norwegians
Cubans
5.5%
SINGLE MOTHER HOUSEHOLDS
99.3/ 100
METRIC RATING
47th/ 347
METRIC RANK
7.2%
SINGLE MOTHER HOUSEHOLDS
0.6/ 100
METRIC RATING
244th/ 347
METRIC RANK
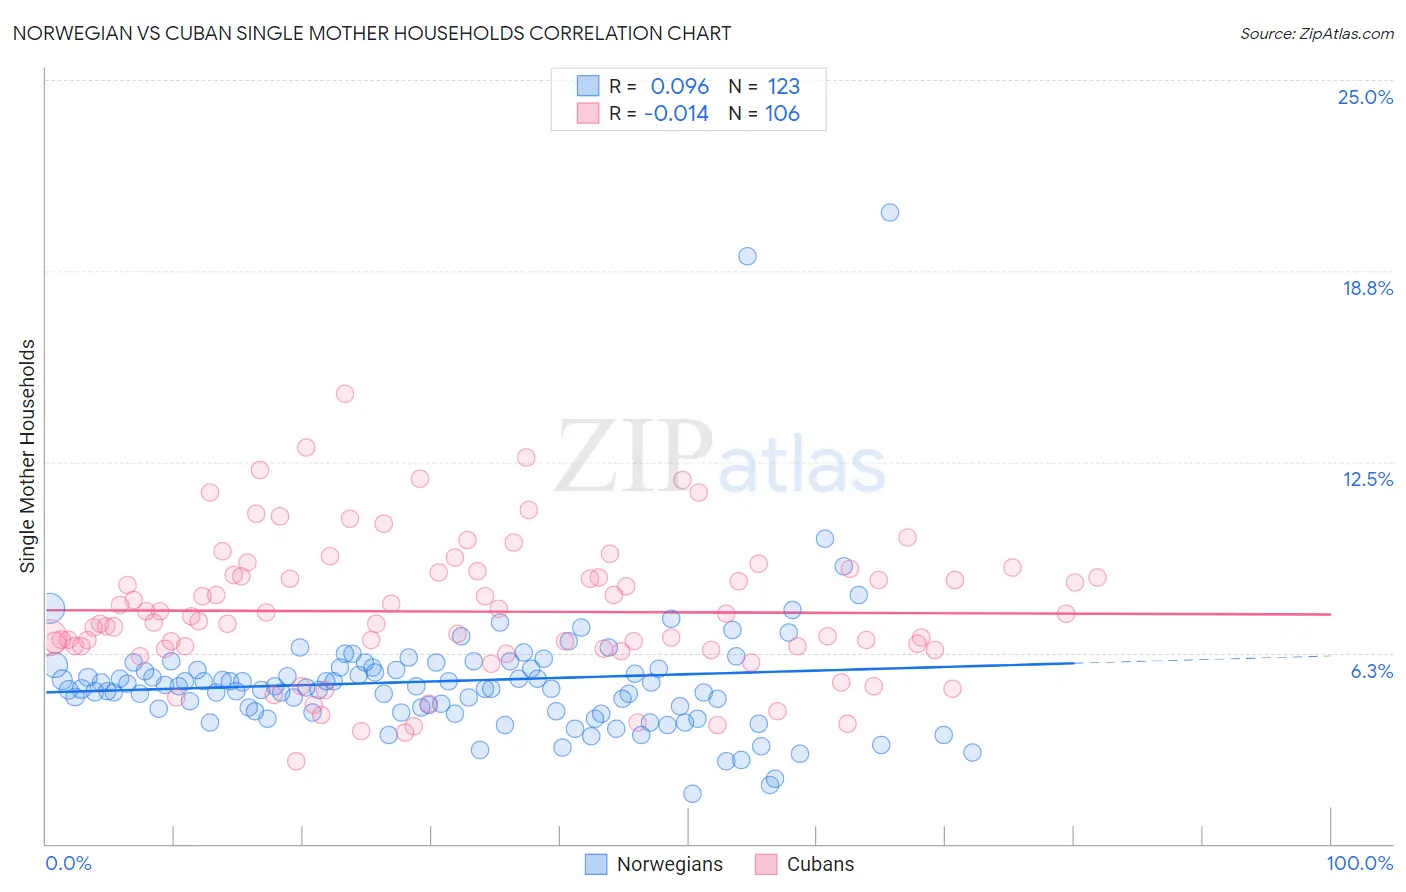
Norwegian vs Cuban Single Mother Households Correlation Chart
The statistical analysis conducted on geographies consisting of 529,367,930 people shows a slight positive correlation between the proportion of Norwegians and percentage of single mother households in the United States with a correlation coefficient (R) of 0.096 and weighted average of 5.5%. Similarly, the statistical analysis conducted on geographies consisting of 447,599,583 people shows no correlation between the proportion of Cubans and percentage of single mother households in the United States with a correlation coefficient (R) of -0.014 and weighted average of 7.2%, a difference of 31.8%.
Single Mother Households Correlation Summary
| Measurement | Norwegian | Cuban |
| Minimum | 1.6% | 2.7% |
| Maximum | 20.7% | 14.7% |
| Range | 19.0% | 12.0% |
| Mean | 5.3% | 7.6% |
| Median | 5.1% | 7.3% |
| Interquartile 25% (IQ1) | 4.3% | 6.4% |
| Interquartile 75% (IQ3) | 5.8% | 8.8% |
| Interquartile Range (IQR) | 1.4% | 2.4% |
| Standard Deviation (Sample) | 2.3% | 2.3% |
| Standard Deviation (Population) | 2.3% | 2.2% |
Similar Demographics by Single Mother Households
Demographics Similar to Norwegians by Single Mother Households
In terms of single mother households, the demographic groups most similar to Norwegians are Croatian (5.5%, a difference of 0.18%), Turkish (5.5%, a difference of 0.20%), Immigrants from Latvia (5.5%, a difference of 0.23%), Immigrants from Scotland (5.5%, a difference of 0.42%), and Immigrants from Croatia (5.4%, a difference of 0.44%).
| Demographics | Rating | Rank | Single Mother Households |
| Estonians | 99.6 /100 | #40 | Exceptional 5.4% |
| Immigrants | Greece | 99.5 /100 | #41 | Exceptional 5.4% |
| Macedonians | 99.5 /100 | #42 | Exceptional 5.4% |
| Immigrants | South Central Asia | 99.5 /100 | #43 | Exceptional 5.4% |
| Lithuanians | 99.4 /100 | #44 | Exceptional 5.4% |
| Immigrants | Croatia | 99.4 /100 | #45 | Exceptional 5.4% |
| Croatians | 99.3 /100 | #46 | Exceptional 5.5% |
| Norwegians | 99.3 /100 | #47 | Exceptional 5.5% |
| Turks | 99.2 /100 | #48 | Exceptional 5.5% |
| Immigrants | Latvia | 99.2 /100 | #49 | Exceptional 5.5% |
| Immigrants | Scotland | 99.2 /100 | #50 | Exceptional 5.5% |
| Immigrants | Belarus | 99.2 /100 | #51 | Exceptional 5.5% |
| Swedes | 99.1 /100 | #52 | Exceptional 5.5% |
| Immigrants | Russia | 99.1 /100 | #53 | Exceptional 5.5% |
| Immigrants | Lebanon | 99.1 /100 | #54 | Exceptional 5.5% |
Demographics Similar to Cubans by Single Mother Households
In terms of single mother households, the demographic groups most similar to Cubans are Ecuadorian (7.2%, a difference of 0.070%), Fijian (7.2%, a difference of 0.11%), Immigrants from Portugal (7.2%, a difference of 0.19%), Immigrants from Cambodia (7.2%, a difference of 0.34%), and Nicaraguan (7.2%, a difference of 0.53%).
| Demographics | Rating | Rank | Single Mother Households |
| Arapaho | 1.0 /100 | #237 | Tragic 7.1% |
| Panamanians | 0.9 /100 | #238 | Tragic 7.1% |
| Kiowa | 0.8 /100 | #239 | Tragic 7.1% |
| Immigrants | Panama | 0.7 /100 | #240 | Tragic 7.2% |
| Immigrants | Portugal | 0.6 /100 | #241 | Tragic 7.2% |
| Fijians | 0.6 /100 | #242 | Tragic 7.2% |
| Ecuadorians | 0.6 /100 | #243 | Tragic 7.2% |
| Cubans | 0.6 /100 | #244 | Tragic 7.2% |
| Immigrants | Cambodia | 0.5 /100 | #245 | Tragic 7.2% |
| Nicaraguans | 0.5 /100 | #246 | Tragic 7.2% |
| Dutch West Indians | 0.4 /100 | #247 | Tragic 7.3% |
| Spanish American Indians | 0.4 /100 | #248 | Tragic 7.3% |
| Bermudans | 0.4 /100 | #249 | Tragic 7.3% |
| Immigrants | Africa | 0.4 /100 | #250 | Tragic 7.3% |
| Malaysians | 0.3 /100 | #251 | Tragic 7.3% |