Cambodian vs Cuban Single Mother Households
COMPARE
Cambodian
Cuban
Single Mother Households
Single Mother Households Comparison
Cambodians
Cubans
5.3%
SINGLE MOTHER HOUSEHOLDS
99.7/ 100
METRIC RATING
32nd/ 347
METRIC RANK
7.2%
SINGLE MOTHER HOUSEHOLDS
0.6/ 100
METRIC RATING
244th/ 347
METRIC RANK
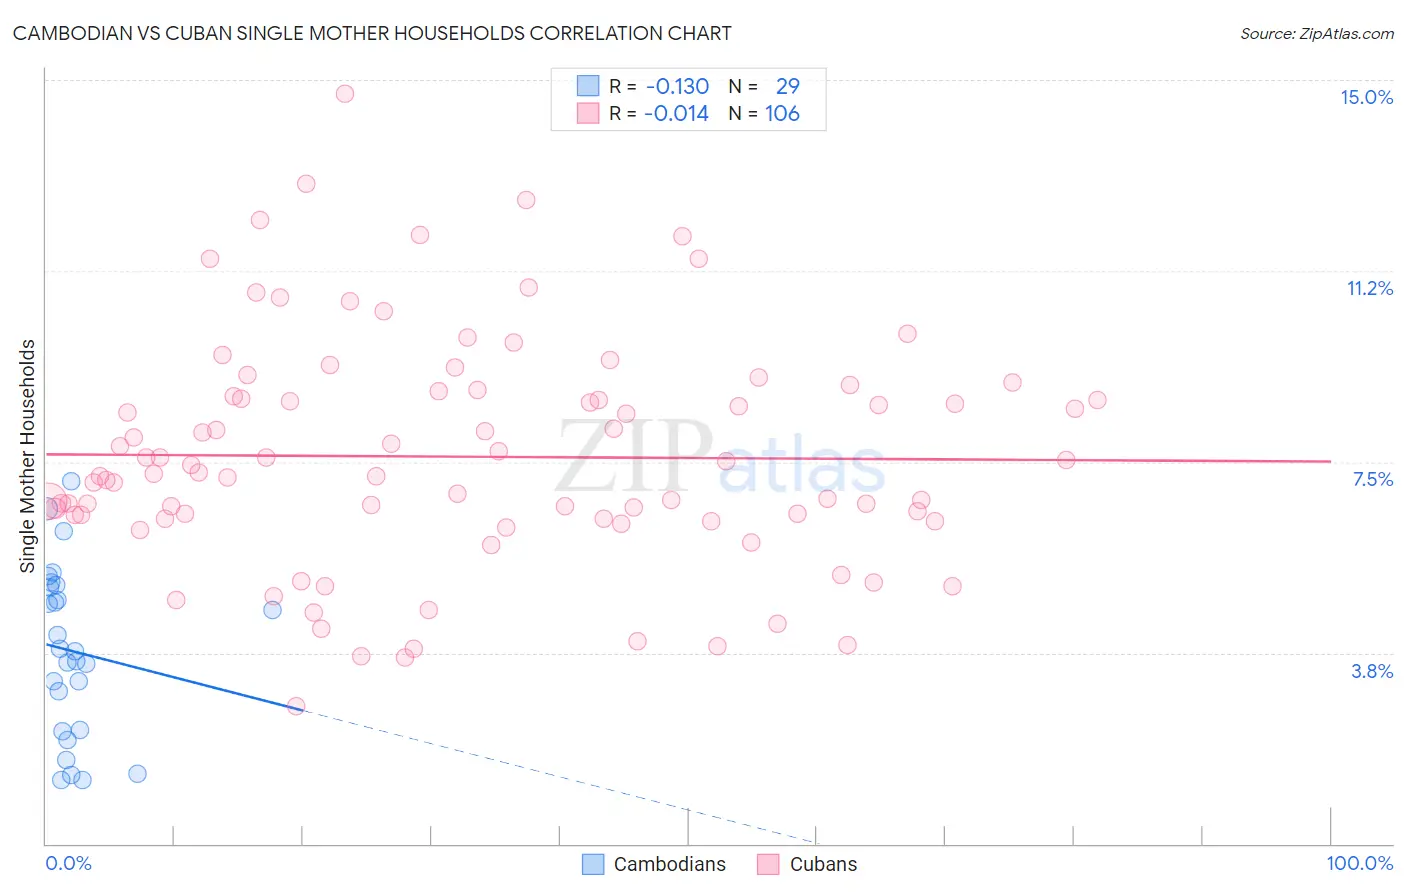
Cambodian vs Cuban Single Mother Households Correlation Chart
The statistical analysis conducted on geographies consisting of 102,433,936 people shows a poor negative correlation between the proportion of Cambodians and percentage of single mother households in the United States with a correlation coefficient (R) of -0.130 and weighted average of 5.3%. Similarly, the statistical analysis conducted on geographies consisting of 447,599,583 people shows no correlation between the proportion of Cubans and percentage of single mother households in the United States with a correlation coefficient (R) of -0.014 and weighted average of 7.2%, a difference of 36.2%.
Single Mother Households Correlation Summary
| Measurement | Cambodian | Cuban |
| Minimum | 1.2% | 2.7% |
| Maximum | 7.1% | 14.7% |
| Range | 5.9% | 12.0% |
| Mean | 3.8% | 7.6% |
| Median | 3.8% | 7.3% |
| Interquartile 25% (IQ1) | 2.2% | 6.4% |
| Interquartile 75% (IQ3) | 5.1% | 8.8% |
| Interquartile Range (IQR) | 2.8% | 2.4% |
| Standard Deviation (Sample) | 1.6% | 2.3% |
| Standard Deviation (Population) | 1.6% | 2.2% |
Similar Demographics by Single Mother Households
Demographics Similar to Cambodians by Single Mother Households
In terms of single mother households, the demographic groups most similar to Cambodians are Burmese (5.3%, a difference of 0.010%), Immigrants from Korea (5.3%, a difference of 0.010%), Latvian (5.3%, a difference of 0.070%), Russian (5.3%, a difference of 0.090%), and Bhutanese (5.3%, a difference of 0.19%).
| Demographics | Rating | Rank | Single Mother Households |
| Immigrants | Japan | 99.8 /100 | #25 | Exceptional 5.2% |
| Immigrants | Lithuania | 99.8 /100 | #26 | Exceptional 5.3% |
| Bhutanese | 99.7 /100 | #27 | Exceptional 5.3% |
| Russians | 99.7 /100 | #28 | Exceptional 5.3% |
| Latvians | 99.7 /100 | #29 | Exceptional 5.3% |
| Burmese | 99.7 /100 | #30 | Exceptional 5.3% |
| Immigrants | Korea | 99.7 /100 | #31 | Exceptional 5.3% |
| Cambodians | 99.7 /100 | #32 | Exceptional 5.3% |
| Immigrants | Switzerland | 99.7 /100 | #33 | Exceptional 5.3% |
| Bulgarians | 99.7 /100 | #34 | Exceptional 5.3% |
| Immigrants | Northern Europe | 99.7 /100 | #35 | Exceptional 5.3% |
| Immigrants | Czechoslovakia | 99.7 /100 | #36 | Exceptional 5.3% |
| Immigrants | Belgium | 99.7 /100 | #37 | Exceptional 5.3% |
| Immigrants | Serbia | 99.6 /100 | #38 | Exceptional 5.4% |
| Immigrants | Sweden | 99.6 /100 | #39 | Exceptional 5.4% |
Demographics Similar to Cubans by Single Mother Households
In terms of single mother households, the demographic groups most similar to Cubans are Ecuadorian (7.2%, a difference of 0.070%), Fijian (7.2%, a difference of 0.11%), Immigrants from Portugal (7.2%, a difference of 0.19%), Immigrants from Cambodia (7.2%, a difference of 0.34%), and Nicaraguan (7.2%, a difference of 0.53%).
| Demographics | Rating | Rank | Single Mother Households |
| Arapaho | 1.0 /100 | #237 | Tragic 7.1% |
| Panamanians | 0.9 /100 | #238 | Tragic 7.1% |
| Kiowa | 0.8 /100 | #239 | Tragic 7.1% |
| Immigrants | Panama | 0.7 /100 | #240 | Tragic 7.2% |
| Immigrants | Portugal | 0.6 /100 | #241 | Tragic 7.2% |
| Fijians | 0.6 /100 | #242 | Tragic 7.2% |
| Ecuadorians | 0.6 /100 | #243 | Tragic 7.2% |
| Cubans | 0.6 /100 | #244 | Tragic 7.2% |
| Immigrants | Cambodia | 0.5 /100 | #245 | Tragic 7.2% |
| Nicaraguans | 0.5 /100 | #246 | Tragic 7.2% |
| Dutch West Indians | 0.4 /100 | #247 | Tragic 7.3% |
| Spanish American Indians | 0.4 /100 | #248 | Tragic 7.3% |
| Bermudans | 0.4 /100 | #249 | Tragic 7.3% |
| Immigrants | Africa | 0.4 /100 | #250 | Tragic 7.3% |
| Malaysians | 0.3 /100 | #251 | Tragic 7.3% |