Norwegian vs Immigrants from the Azores Single Mother Households
COMPARE
Norwegian
Immigrants from the Azores
Single Mother Households
Single Mother Households Comparison
Norwegians
Immigrants from the Azores
5.5%
SINGLE MOTHER HOUSEHOLDS
99.3/ 100
METRIC RATING
47th/ 347
METRIC RANK
7.5%
SINGLE MOTHER HOUSEHOLDS
0.1/ 100
METRIC RATING
272nd/ 347
METRIC RANK
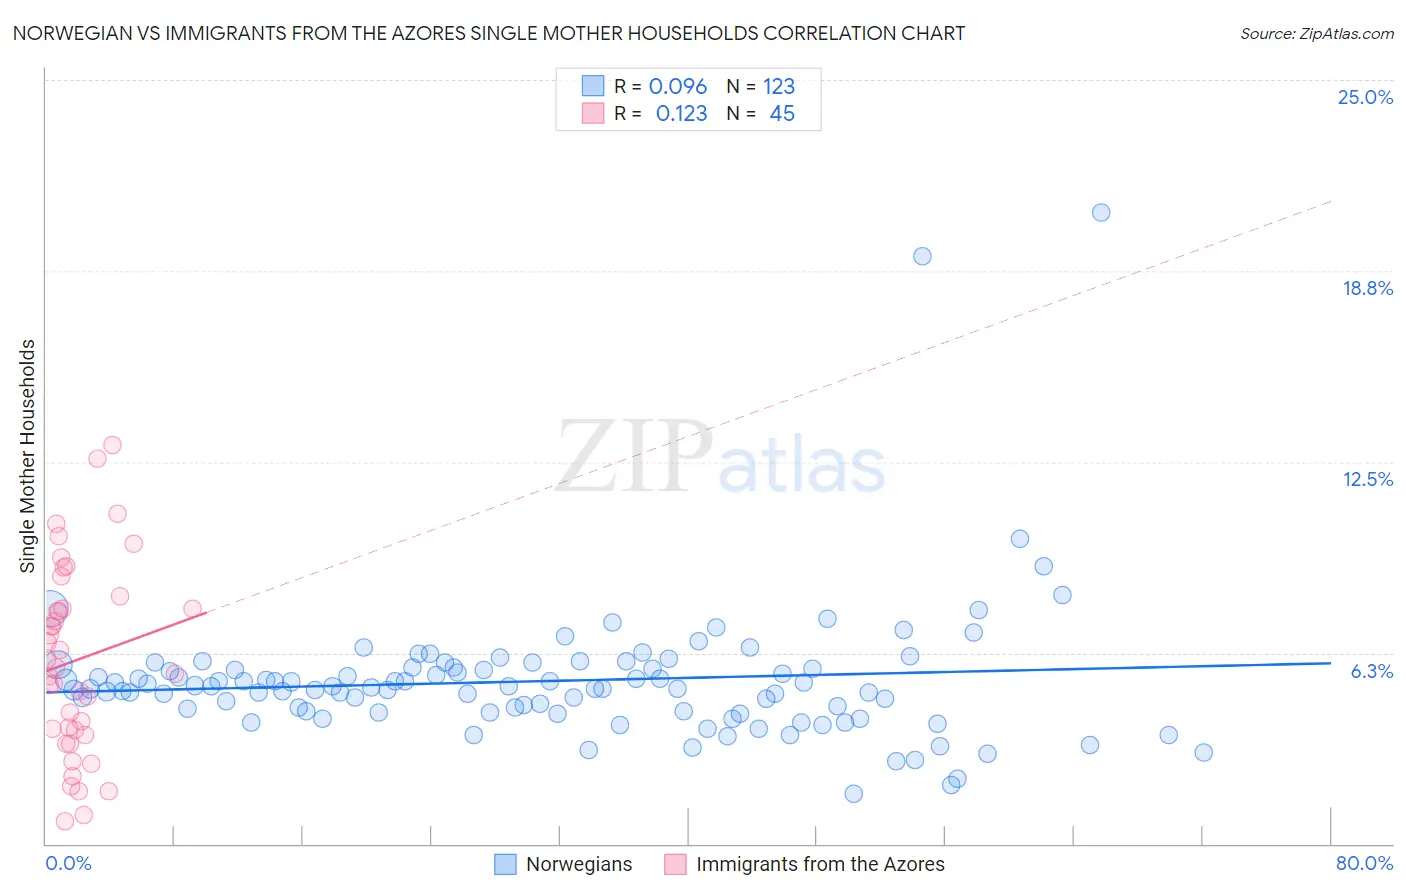
Norwegian vs Immigrants from the Azores Single Mother Households Correlation Chart
The statistical analysis conducted on geographies consisting of 529,367,930 people shows a slight positive correlation between the proportion of Norwegians and percentage of single mother households in the United States with a correlation coefficient (R) of 0.096 and weighted average of 5.5%. Similarly, the statistical analysis conducted on geographies consisting of 46,218,711 people shows a poor positive correlation between the proportion of Immigrants from the Azores and percentage of single mother households in the United States with a correlation coefficient (R) of 0.123 and weighted average of 7.5%, a difference of 37.9%.
Single Mother Households Correlation Summary
| Measurement | Norwegian | Immigrants from the Azores |
| Minimum | 1.6% | 0.74% |
| Maximum | 20.7% | 13.1% |
| Range | 19.0% | 12.3% |
| Mean | 5.3% | 6.0% |
| Median | 5.1% | 5.8% |
| Interquartile 25% (IQ1) | 4.3% | 3.6% |
| Interquartile 75% (IQ3) | 5.8% | 7.9% |
| Interquartile Range (IQR) | 1.4% | 4.3% |
| Standard Deviation (Sample) | 2.3% | 3.1% |
| Standard Deviation (Population) | 2.3% | 3.0% |
Similar Demographics by Single Mother Households
Demographics Similar to Norwegians by Single Mother Households
In terms of single mother households, the demographic groups most similar to Norwegians are Croatian (5.5%, a difference of 0.18%), Turkish (5.5%, a difference of 0.20%), Immigrants from Latvia (5.5%, a difference of 0.23%), Immigrants from Scotland (5.5%, a difference of 0.42%), and Immigrants from Croatia (5.4%, a difference of 0.44%).
| Demographics | Rating | Rank | Single Mother Households |
| Estonians | 99.6 /100 | #40 | Exceptional 5.4% |
| Immigrants | Greece | 99.5 /100 | #41 | Exceptional 5.4% |
| Macedonians | 99.5 /100 | #42 | Exceptional 5.4% |
| Immigrants | South Central Asia | 99.5 /100 | #43 | Exceptional 5.4% |
| Lithuanians | 99.4 /100 | #44 | Exceptional 5.4% |
| Immigrants | Croatia | 99.4 /100 | #45 | Exceptional 5.4% |
| Croatians | 99.3 /100 | #46 | Exceptional 5.5% |
| Norwegians | 99.3 /100 | #47 | Exceptional 5.5% |
| Turks | 99.2 /100 | #48 | Exceptional 5.5% |
| Immigrants | Latvia | 99.2 /100 | #49 | Exceptional 5.5% |
| Immigrants | Scotland | 99.2 /100 | #50 | Exceptional 5.5% |
| Immigrants | Belarus | 99.2 /100 | #51 | Exceptional 5.5% |
| Swedes | 99.1 /100 | #52 | Exceptional 5.5% |
| Immigrants | Russia | 99.1 /100 | #53 | Exceptional 5.5% |
| Immigrants | Lebanon | 99.1 /100 | #54 | Exceptional 5.5% |
Demographics Similar to Immigrants from the Azores by Single Mother Households
In terms of single mother households, the demographic groups most similar to Immigrants from the Azores are Salvadoran (7.5%, a difference of 0.0%), Immigrants from Cuba (7.5%, a difference of 0.090%), Somali (7.5%, a difference of 0.25%), Belizean (7.6%, a difference of 0.31%), and Immigrants from Guyana (7.6%, a difference of 0.36%).
| Demographics | Rating | Rank | Single Mother Households |
| Crow | 0.1 /100 | #265 | Tragic 7.4% |
| Nepalese | 0.1 /100 | #266 | Tragic 7.5% |
| Blackfeet | 0.1 /100 | #267 | Tragic 7.5% |
| Indonesians | 0.1 /100 | #268 | Tragic 7.5% |
| Somalis | 0.1 /100 | #269 | Tragic 7.5% |
| Immigrants | Cuba | 0.1 /100 | #270 | Tragic 7.5% |
| Salvadorans | 0.1 /100 | #271 | Tragic 7.5% |
| Immigrants | Azores | 0.1 /100 | #272 | Tragic 7.5% |
| Belizeans | 0.1 /100 | #273 | Tragic 7.6% |
| Immigrants | Guyana | 0.1 /100 | #274 | Tragic 7.6% |
| Central American Indians | 0.1 /100 | #275 | Tragic 7.6% |
| Guyanese | 0.1 /100 | #276 | Tragic 7.6% |
| Immigrants | Trinidad and Tobago | 0.1 /100 | #277 | Tragic 7.6% |
| Central Americans | 0.1 /100 | #278 | Tragic 7.6% |
| Immigrants | El Salvador | 0.0 /100 | #279 | Tragic 7.6% |