Norwegian vs Cuban Average Family Size
COMPARE
Norwegian
Cuban
Average Family Size
Average Family Size Comparison
Norwegians
Cubans
3.08
AVERAGE FAMILY SIZE
0.0/ 100
METRIC RATING
343rd/ 347
METRIC RANK
3.25
AVERAGE FAMILY SIZE
81.8/ 100
METRIC RATING
138th/ 347
METRIC RANK
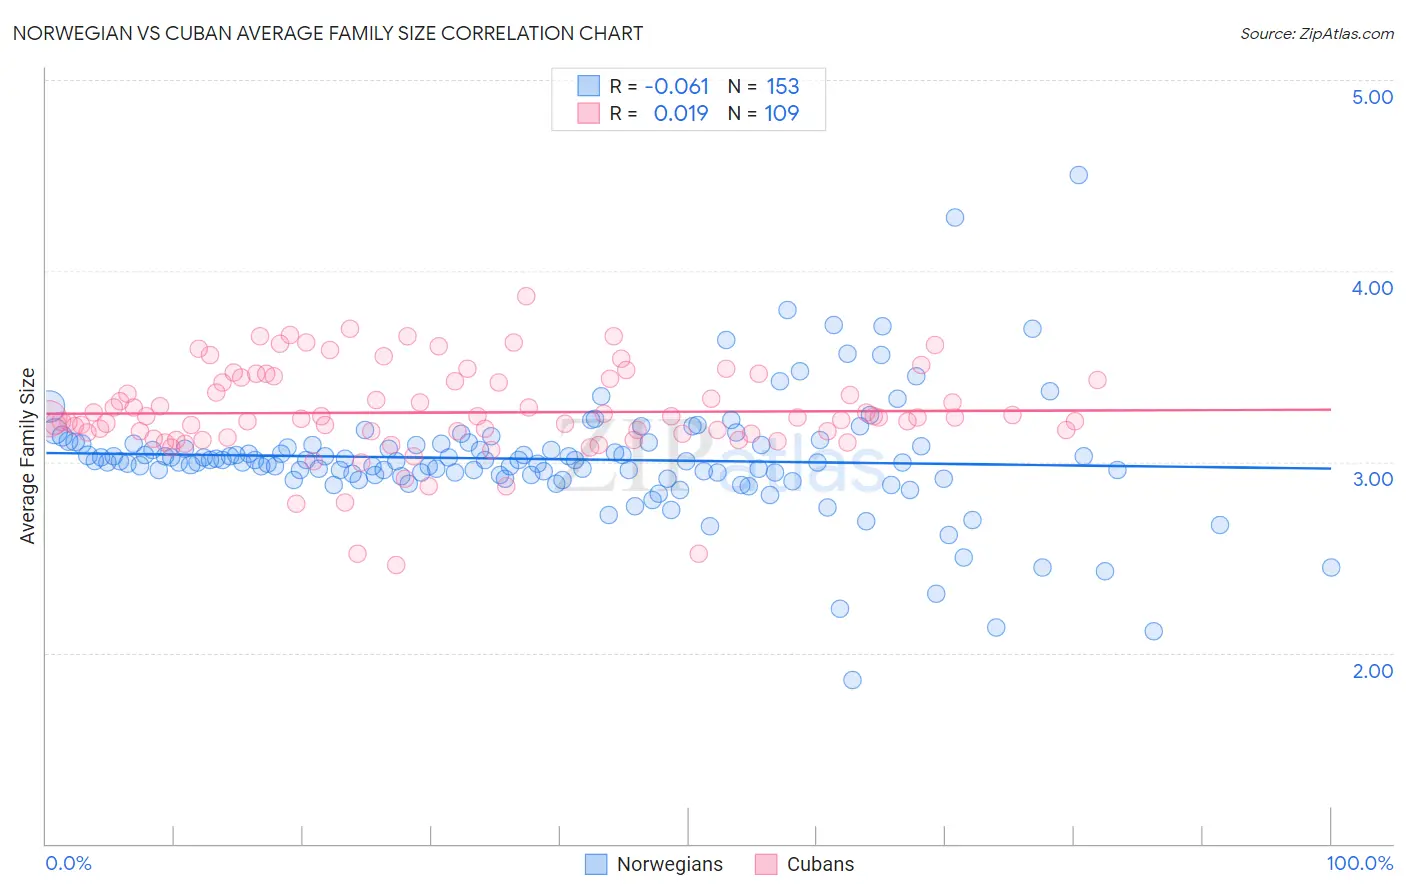
Norwegian vs Cuban Average Family Size Correlation Chart
The statistical analysis conducted on geographies consisting of 532,913,182 people shows a slight negative correlation between the proportion of Norwegians and average family size in the United States with a correlation coefficient (R) of -0.061 and weighted average of 3.08. Similarly, the statistical analysis conducted on geographies consisting of 448,974,535 people shows no correlation between the proportion of Cubans and average family size in the United States with a correlation coefficient (R) of 0.019 and weighted average of 3.25, a difference of 5.5%.
Average Family Size Correlation Summary
| Measurement | Norwegian | Cuban |
| Minimum | 1.86 | 2.46 |
| Maximum | 4.50 | 3.87 |
| Range | 2.64 | 1.41 |
| Mean | 3.01 | 3.26 |
| Median | 3.00 | 3.23 |
| Interquartile 25% (IQ1) | 2.93 | 3.15 |
| Interquartile 75% (IQ3) | 3.09 | 3.43 |
| Interquartile Range (IQR) | 0.16 | 0.28 |
| Standard Deviation (Sample) | 0.31 | 0.24 |
| Standard Deviation (Population) | 0.31 | 0.24 |
Similar Demographics by Average Family Size
Demographics Similar to Norwegians by Average Family Size
In terms of average family size, the demographic groups most similar to Norwegians are German (3.09, a difference of 0.23%), French Canadian (3.07, a difference of 0.24%), Slovene (3.07, a difference of 0.28%), Polish (3.09, a difference of 0.37%), and Finnish (3.09, a difference of 0.42%).
| Demographics | Rating | Rank | Average Family Size |
| Estonians | 0.0 /100 | #333 | Tragic 3.10 |
| Lithuanians | 0.0 /100 | #334 | Tragic 3.10 |
| Luxembourgers | 0.0 /100 | #335 | Tragic 3.10 |
| Irish | 0.0 /100 | #336 | Tragic 3.10 |
| Swedes | 0.0 /100 | #337 | Tragic 3.10 |
| French | 0.0 /100 | #338 | Tragic 3.10 |
| Croatians | 0.0 /100 | #339 | Tragic 3.10 |
| Finns | 0.0 /100 | #340 | Tragic 3.09 |
| Poles | 0.0 /100 | #341 | Tragic 3.09 |
| Germans | 0.0 /100 | #342 | Tragic 3.09 |
| Norwegians | 0.0 /100 | #343 | Tragic 3.08 |
| French Canadians | 0.0 /100 | #344 | Tragic 3.07 |
| Slovenes | 0.0 /100 | #345 | Tragic 3.07 |
| Slovaks | 0.0 /100 | #346 | Tragic 3.06 |
| Carpatho Rusyns | 0.0 /100 | #347 | Tragic 3.06 |
Demographics Similar to Cubans by Average Family Size
In terms of average family size, the demographic groups most similar to Cubans are Immigrants from Ethiopia (3.25, a difference of 0.010%), Subsaharan African (3.25, a difference of 0.010%), Venezuelan (3.25, a difference of 0.010%), Immigrants from Middle Africa (3.25, a difference of 0.020%), and Liberian (3.25, a difference of 0.020%).
| Demographics | Rating | Rank | Average Family Size |
| Immigrants | Western Asia | 87.7 /100 | #131 | Excellent 3.26 |
| Costa Ricans | 86.8 /100 | #132 | Excellent 3.26 |
| Immigrants | Venezuela | 86.3 /100 | #133 | Excellent 3.26 |
| Africans | 84.9 /100 | #134 | Excellent 3.25 |
| Panamanians | 84.2 /100 | #135 | Excellent 3.25 |
| Comanche | 82.8 /100 | #136 | Excellent 3.25 |
| Immigrants | Middle Africa | 82.4 /100 | #137 | Excellent 3.25 |
| Cubans | 81.8 /100 | #138 | Excellent 3.25 |
| Immigrants | Ethiopia | 81.6 /100 | #139 | Excellent 3.25 |
| Sub-Saharan Africans | 81.6 /100 | #140 | Excellent 3.25 |
| Venezuelans | 81.4 /100 | #141 | Excellent 3.25 |
| Liberians | 81.2 /100 | #142 | Excellent 3.25 |
| Bhutanese | 81.0 /100 | #143 | Excellent 3.25 |
| Tsimshian | 80.2 /100 | #144 | Excellent 3.25 |
| Armenians | 78.2 /100 | #145 | Good 3.25 |