Icelander vs Cuban Single Mother Households
COMPARE
Icelander
Cuban
Single Mother Households
Single Mother Households Comparison
Icelanders
Cubans
6.0%
SINGLE MOTHER HOUSEHOLDS
86.9/ 100
METRIC RATING
138th/ 347
METRIC RANK
7.2%
SINGLE MOTHER HOUSEHOLDS
0.6/ 100
METRIC RATING
244th/ 347
METRIC RANK
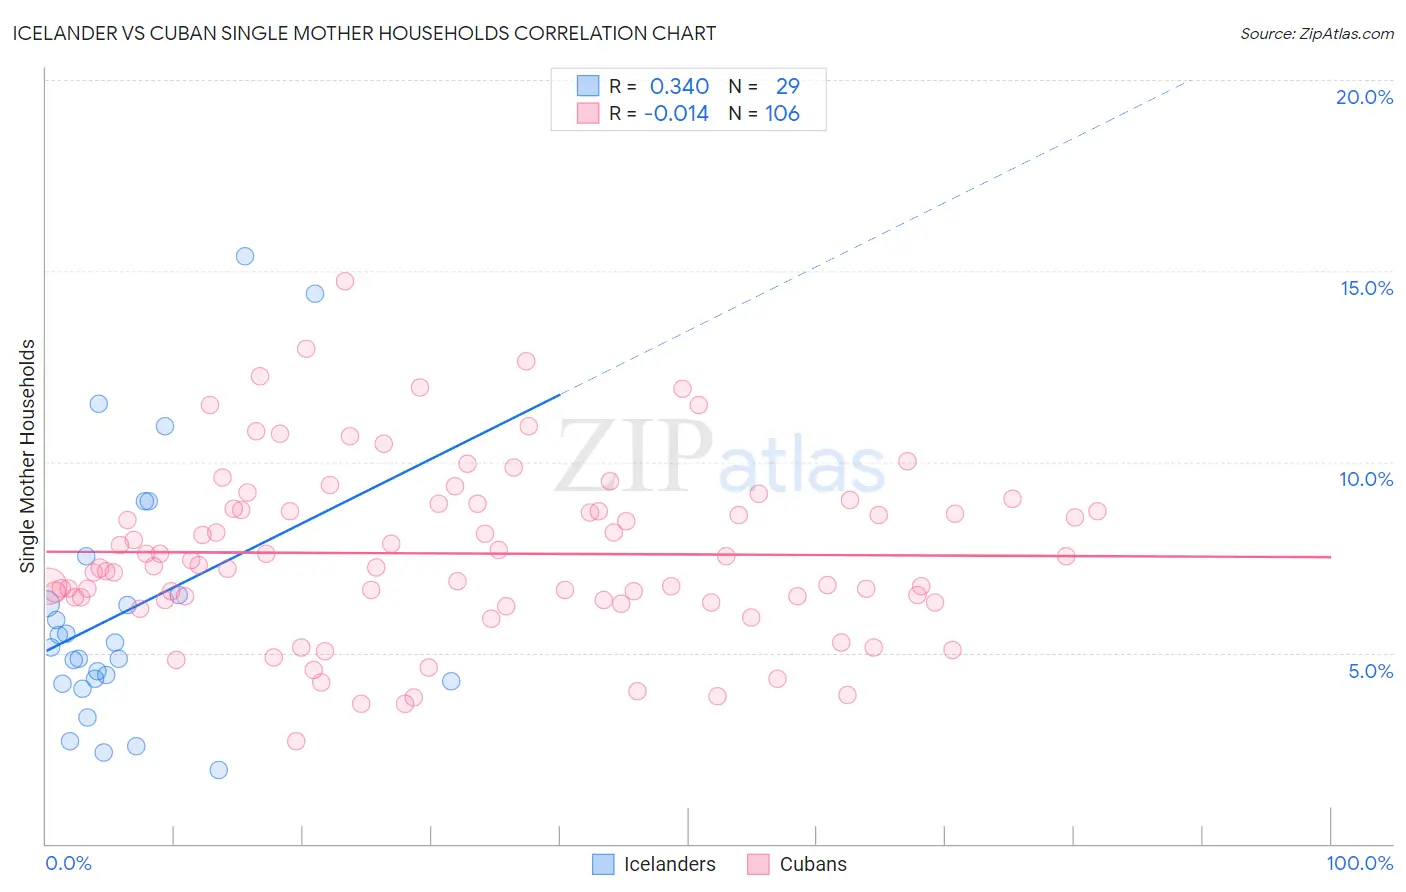
Icelander vs Cuban Single Mother Households Correlation Chart
The statistical analysis conducted on geographies consisting of 159,379,792 people shows a mild positive correlation between the proportion of Icelanders and percentage of single mother households in the United States with a correlation coefficient (R) of 0.340 and weighted average of 6.0%. Similarly, the statistical analysis conducted on geographies consisting of 447,599,583 people shows no correlation between the proportion of Cubans and percentage of single mother households in the United States with a correlation coefficient (R) of -0.014 and weighted average of 7.2%, a difference of 20.3%.
Single Mother Households Correlation Summary
| Measurement | Icelander | Cuban |
| Minimum | 1.9% | 2.7% |
| Maximum | 15.4% | 14.7% |
| Range | 13.5% | 12.0% |
| Mean | 6.1% | 7.6% |
| Median | 5.1% | 7.3% |
| Interquartile 25% (IQ1) | 4.2% | 6.4% |
| Interquartile 75% (IQ3) | 7.0% | 8.8% |
| Interquartile Range (IQR) | 2.8% | 2.4% |
| Standard Deviation (Sample) | 3.4% | 2.3% |
| Standard Deviation (Population) | 3.3% | 2.2% |
Similar Demographics by Single Mother Households
Demographics Similar to Icelanders by Single Mother Households
In terms of single mother households, the demographic groups most similar to Icelanders are Syrian (6.0%, a difference of 0.23%), French (6.0%, a difference of 0.30%), Tsimshian (6.0%, a difference of 0.40%), Immigrants from Pakistan (6.0%, a difference of 0.41%), and Immigrants from Egypt (6.0%, a difference of 0.45%).
| Demographics | Rating | Rank | Single Mother Households |
| Immigrants | Spain | 91.2 /100 | #131 | Exceptional 5.9% |
| Albanians | 91.1 /100 | #132 | Exceptional 5.9% |
| Egyptians | 90.7 /100 | #133 | Exceptional 5.9% |
| Canadians | 90.5 /100 | #134 | Exceptional 5.9% |
| Immigrants | Saudi Arabia | 90.2 /100 | #135 | Exceptional 5.9% |
| Jordanians | 88.9 /100 | #136 | Excellent 6.0% |
| Immigrants | Pakistan | 88.4 /100 | #137 | Excellent 6.0% |
| Icelanders | 86.9 /100 | #138 | Excellent 6.0% |
| Syrians | 86.0 /100 | #139 | Excellent 6.0% |
| French | 85.7 /100 | #140 | Excellent 6.0% |
| Tsimshian | 85.2 /100 | #141 | Excellent 6.0% |
| Immigrants | Egypt | 85.0 /100 | #142 | Excellent 6.0% |
| Immigrants | Iraq | 84.8 /100 | #143 | Excellent 6.0% |
| Koreans | 84.4 /100 | #144 | Excellent 6.0% |
| Arabs | 84.0 /100 | #145 | Excellent 6.0% |
Demographics Similar to Cubans by Single Mother Households
In terms of single mother households, the demographic groups most similar to Cubans are Ecuadorian (7.2%, a difference of 0.070%), Fijian (7.2%, a difference of 0.11%), Immigrants from Portugal (7.2%, a difference of 0.19%), Immigrants from Cambodia (7.2%, a difference of 0.34%), and Nicaraguan (7.2%, a difference of 0.53%).
| Demographics | Rating | Rank | Single Mother Households |
| Arapaho | 1.0 /100 | #237 | Tragic 7.1% |
| Panamanians | 0.9 /100 | #238 | Tragic 7.1% |
| Kiowa | 0.8 /100 | #239 | Tragic 7.1% |
| Immigrants | Panama | 0.7 /100 | #240 | Tragic 7.2% |
| Immigrants | Portugal | 0.6 /100 | #241 | Tragic 7.2% |
| Fijians | 0.6 /100 | #242 | Tragic 7.2% |
| Ecuadorians | 0.6 /100 | #243 | Tragic 7.2% |
| Cubans | 0.6 /100 | #244 | Tragic 7.2% |
| Immigrants | Cambodia | 0.5 /100 | #245 | Tragic 7.2% |
| Nicaraguans | 0.5 /100 | #246 | Tragic 7.2% |
| Dutch West Indians | 0.4 /100 | #247 | Tragic 7.3% |
| Spanish American Indians | 0.4 /100 | #248 | Tragic 7.3% |
| Bermudans | 0.4 /100 | #249 | Tragic 7.3% |
| Immigrants | Africa | 0.4 /100 | #250 | Tragic 7.3% |
| Malaysians | 0.3 /100 | #251 | Tragic 7.3% |