Norwegian vs Immigrants from Ireland Single Mother Households
COMPARE
Norwegian
Immigrants from Ireland
Single Mother Households
Single Mother Households Comparison
Norwegians
Immigrants from Ireland
5.5%
SINGLE MOTHER HOUSEHOLDS
99.3/ 100
METRIC RATING
47th/ 347
METRIC RANK
5.0%
SINGLE MOTHER HOUSEHOLDS
99.9/ 100
METRIC RATING
8th/ 347
METRIC RANK
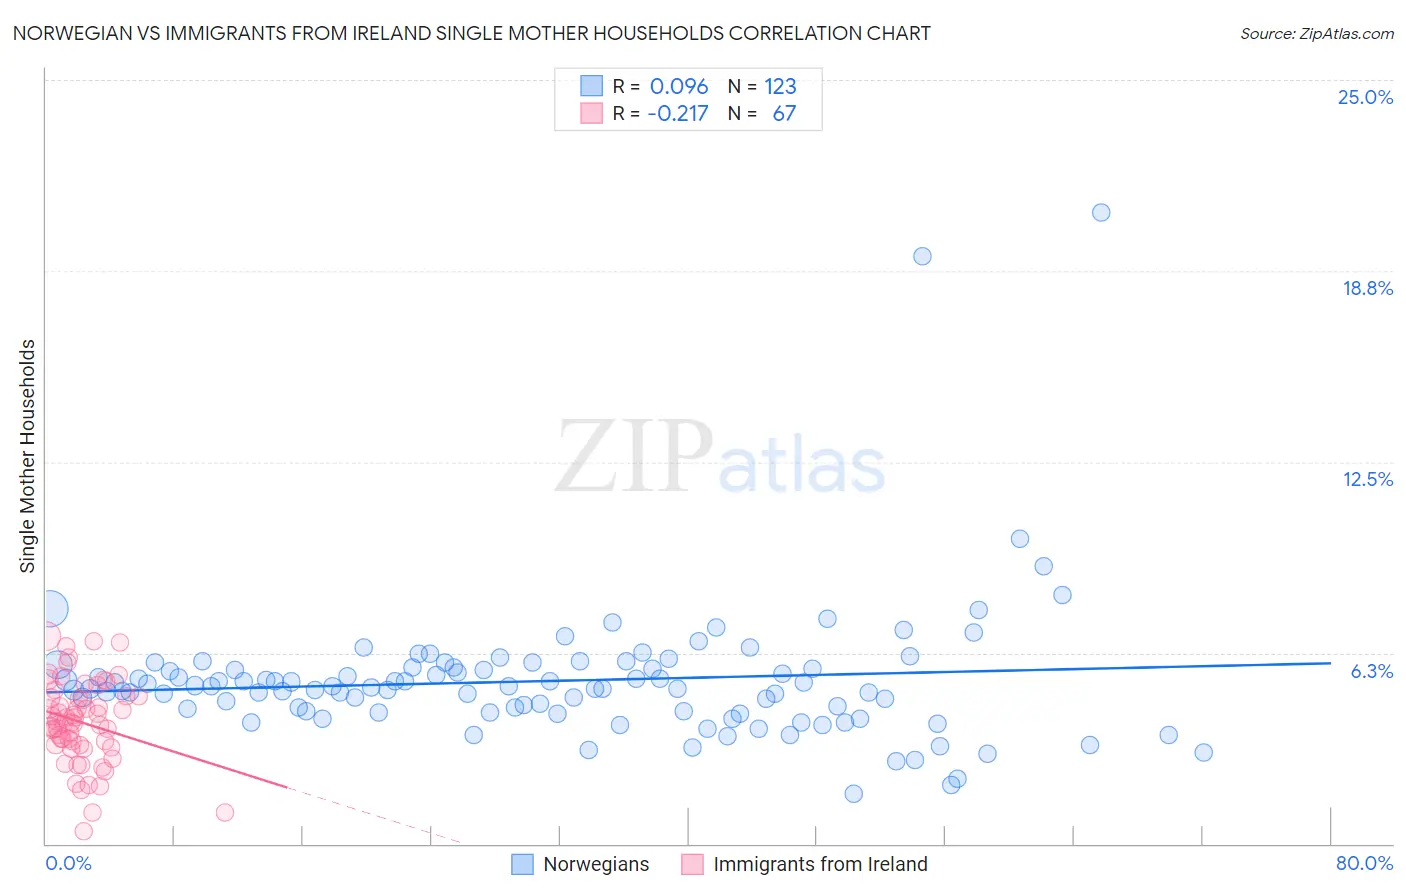
Norwegian vs Immigrants from Ireland Single Mother Households Correlation Chart
The statistical analysis conducted on geographies consisting of 529,367,930 people shows a slight positive correlation between the proportion of Norwegians and percentage of single mother households in the United States with a correlation coefficient (R) of 0.096 and weighted average of 5.5%. Similarly, the statistical analysis conducted on geographies consisting of 240,180,229 people shows a weak negative correlation between the proportion of Immigrants from Ireland and percentage of single mother households in the United States with a correlation coefficient (R) of -0.217 and weighted average of 5.0%, a difference of 9.2%.
Single Mother Households Correlation Summary
| Measurement | Norwegian | Immigrants from Ireland |
| Minimum | 1.6% | 0.40% |
| Maximum | 20.7% | 6.8% |
| Range | 19.0% | 6.4% |
| Mean | 5.3% | 4.0% |
| Median | 5.1% | 4.0% |
| Interquartile 25% (IQ1) | 4.3% | 3.2% |
| Interquartile 75% (IQ3) | 5.8% | 4.8% |
| Interquartile Range (IQR) | 1.4% | 1.6% |
| Standard Deviation (Sample) | 2.3% | 1.4% |
| Standard Deviation (Population) | 2.3% | 1.4% |
Similar Demographics by Single Mother Households
Demographics Similar to Norwegians by Single Mother Households
In terms of single mother households, the demographic groups most similar to Norwegians are Croatian (5.5%, a difference of 0.18%), Turkish (5.5%, a difference of 0.20%), Immigrants from Latvia (5.5%, a difference of 0.23%), Immigrants from Scotland (5.5%, a difference of 0.42%), and Immigrants from Croatia (5.4%, a difference of 0.44%).
| Demographics | Rating | Rank | Single Mother Households |
| Estonians | 99.6 /100 | #40 | Exceptional 5.4% |
| Immigrants | Greece | 99.5 /100 | #41 | Exceptional 5.4% |
| Macedonians | 99.5 /100 | #42 | Exceptional 5.4% |
| Immigrants | South Central Asia | 99.5 /100 | #43 | Exceptional 5.4% |
| Lithuanians | 99.4 /100 | #44 | Exceptional 5.4% |
| Immigrants | Croatia | 99.4 /100 | #45 | Exceptional 5.4% |
| Croatians | 99.3 /100 | #46 | Exceptional 5.5% |
| Norwegians | 99.3 /100 | #47 | Exceptional 5.5% |
| Turks | 99.2 /100 | #48 | Exceptional 5.5% |
| Immigrants | Latvia | 99.2 /100 | #49 | Exceptional 5.5% |
| Immigrants | Scotland | 99.2 /100 | #50 | Exceptional 5.5% |
| Immigrants | Belarus | 99.2 /100 | #51 | Exceptional 5.5% |
| Swedes | 99.1 /100 | #52 | Exceptional 5.5% |
| Immigrants | Russia | 99.1 /100 | #53 | Exceptional 5.5% |
| Immigrants | Lebanon | 99.1 /100 | #54 | Exceptional 5.5% |
Demographics Similar to Immigrants from Ireland by Single Mother Households
In terms of single mother households, the demographic groups most similar to Immigrants from Ireland are Okinawan (5.0%, a difference of 0.15%), Immigrants from Israel (5.0%, a difference of 0.49%), Iranian (5.0%, a difference of 0.66%), Immigrants from Singapore (5.0%, a difference of 0.91%), and Immigrants from China (5.1%, a difference of 1.1%).
| Demographics | Rating | Rank | Single Mother Households |
| Immigrants | Taiwan | 100.0 /100 | #1 | Exceptional 4.7% |
| Filipinos | 100.0 /100 | #2 | Exceptional 4.7% |
| Immigrants | Iran | 100.0 /100 | #3 | Exceptional 4.8% |
| Assyrians/Chaldeans/Syriacs | 100.0 /100 | #4 | Exceptional 4.8% |
| Immigrants | Hong Kong | 100.0 /100 | #5 | Exceptional 4.8% |
| Immigrants | Singapore | 100.0 /100 | #6 | Exceptional 5.0% |
| Iranians | 100.0 /100 | #7 | Exceptional 5.0% |
| Immigrants | Ireland | 99.9 /100 | #8 | Exceptional 5.0% |
| Okinawans | 99.9 /100 | #9 | Exceptional 5.0% |
| Immigrants | Israel | 99.9 /100 | #10 | Exceptional 5.0% |
| Immigrants | China | 99.9 /100 | #11 | Exceptional 5.1% |
| Cypriots | 99.9 /100 | #12 | Exceptional 5.1% |
| Immigrants | India | 99.9 /100 | #13 | Exceptional 5.1% |
| Immigrants | Australia | 99.9 /100 | #14 | Exceptional 5.1% |
| Immigrants | Eastern Asia | 99.9 /100 | #15 | Exceptional 5.1% |