English vs Cuban Single Mother Households
COMPARE
English
Cuban
Single Mother Households
Single Mother Households Comparison
English
Cubans
5.8%
SINGLE MOTHER HOUSEHOLDS
96.2/ 100
METRIC RATING
102nd/ 347
METRIC RANK
7.2%
SINGLE MOTHER HOUSEHOLDS
0.6/ 100
METRIC RATING
244th/ 347
METRIC RANK
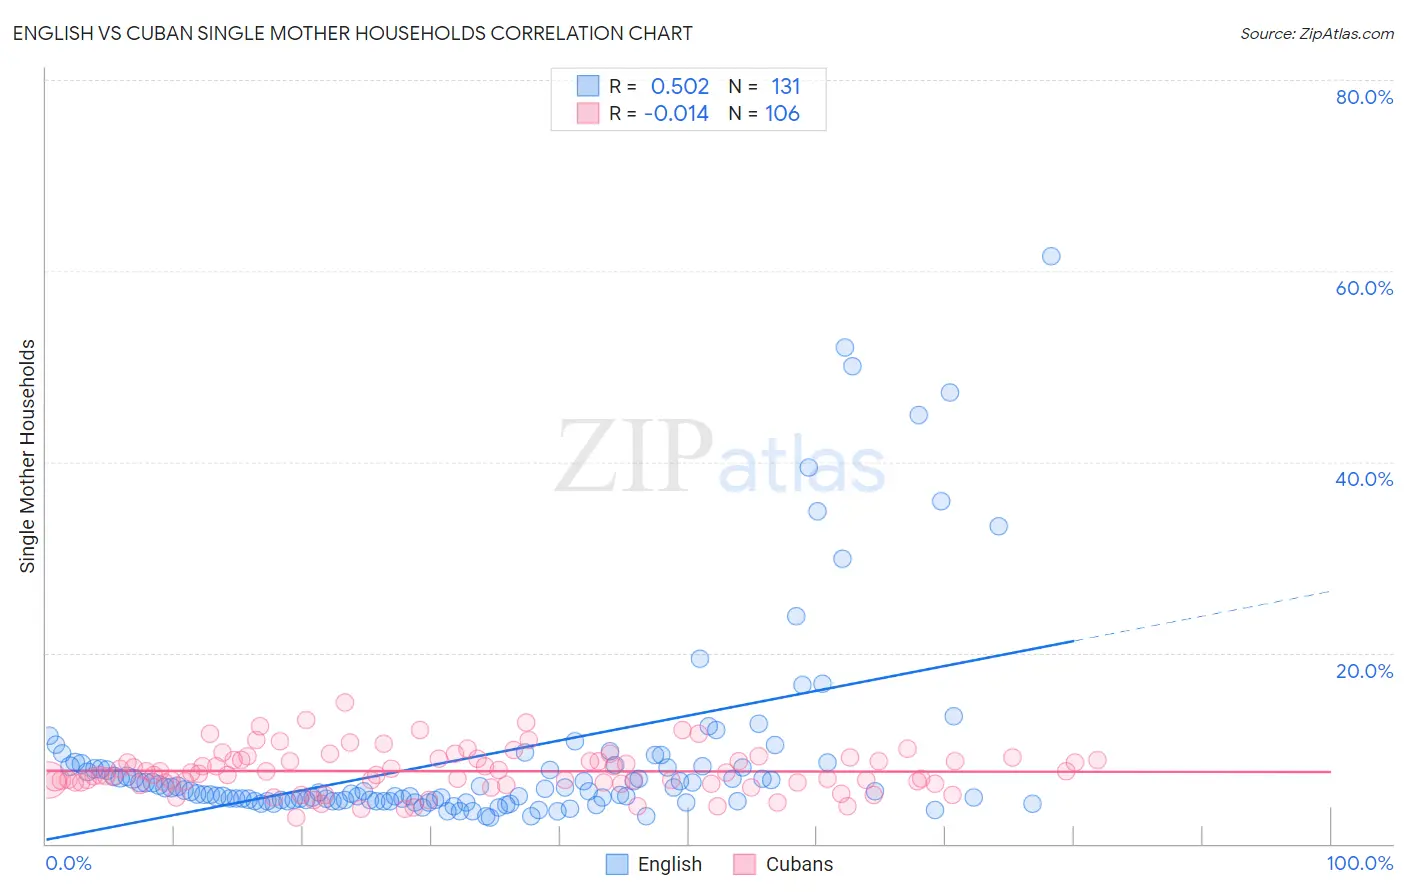
English vs Cuban Single Mother Households Correlation Chart
The statistical analysis conducted on geographies consisting of 572,865,481 people shows a substantial positive correlation between the proportion of English and percentage of single mother households in the United States with a correlation coefficient (R) of 0.502 and weighted average of 5.8%. Similarly, the statistical analysis conducted on geographies consisting of 447,599,583 people shows no correlation between the proportion of Cubans and percentage of single mother households in the United States with a correlation coefficient (R) of -0.014 and weighted average of 7.2%, a difference of 25.2%.
Single Mother Households Correlation Summary
| Measurement | English | Cuban |
| Minimum | 2.8% | 2.7% |
| Maximum | 61.5% | 14.7% |
| Range | 58.8% | 12.0% |
| Mean | 9.2% | 7.6% |
| Median | 5.5% | 7.3% |
| Interquartile 25% (IQ1) | 4.5% | 6.4% |
| Interquartile 75% (IQ3) | 8.1% | 8.8% |
| Interquartile Range (IQR) | 3.6% | 2.4% |
| Standard Deviation (Sample) | 10.6% | 2.3% |
| Standard Deviation (Population) | 10.5% | 2.2% |
Similar Demographics by Single Mother Households
Demographics Similar to English by Single Mother Households
In terms of single mother households, the demographic groups most similar to English are German (5.8%, a difference of 0.0%), Scottish (5.8%, a difference of 0.020%), Northern European (5.8%, a difference of 0.020%), Scandinavian (5.8%, a difference of 0.030%), and Immigrants from Poland (5.8%, a difference of 0.050%).
| Demographics | Rating | Rank | Single Mother Households |
| Slovaks | 96.6 /100 | #95 | Exceptional 5.7% |
| Austrians | 96.4 /100 | #96 | Exceptional 5.7% |
| Tlingit-Haida | 96.4 /100 | #97 | Exceptional 5.7% |
| Immigrants | South Africa | 96.3 /100 | #98 | Exceptional 5.7% |
| Immigrants | Poland | 96.3 /100 | #99 | Exceptional 5.8% |
| Scandinavians | 96.2 /100 | #100 | Exceptional 5.8% |
| Germans | 96.2 /100 | #101 | Exceptional 5.8% |
| English | 96.2 /100 | #102 | Exceptional 5.8% |
| Scottish | 96.2 /100 | #103 | Exceptional 5.8% |
| Northern Europeans | 96.2 /100 | #104 | Exceptional 5.8% |
| Taiwanese | 96.1 /100 | #105 | Exceptional 5.8% |
| Immigrants | Ukraine | 95.9 /100 | #106 | Exceptional 5.8% |
| Paraguayans | 95.8 /100 | #107 | Exceptional 5.8% |
| Immigrants | Italy | 95.8 /100 | #108 | Exceptional 5.8% |
| Immigrants | Western Europe | 95.7 /100 | #109 | Exceptional 5.8% |
Demographics Similar to Cubans by Single Mother Households
In terms of single mother households, the demographic groups most similar to Cubans are Ecuadorian (7.2%, a difference of 0.070%), Fijian (7.2%, a difference of 0.11%), Immigrants from Portugal (7.2%, a difference of 0.19%), Immigrants from Cambodia (7.2%, a difference of 0.34%), and Nicaraguan (7.2%, a difference of 0.53%).
| Demographics | Rating | Rank | Single Mother Households |
| Arapaho | 1.0 /100 | #237 | Tragic 7.1% |
| Panamanians | 0.9 /100 | #238 | Tragic 7.1% |
| Kiowa | 0.8 /100 | #239 | Tragic 7.1% |
| Immigrants | Panama | 0.7 /100 | #240 | Tragic 7.2% |
| Immigrants | Portugal | 0.6 /100 | #241 | Tragic 7.2% |
| Fijians | 0.6 /100 | #242 | Tragic 7.2% |
| Ecuadorians | 0.6 /100 | #243 | Tragic 7.2% |
| Cubans | 0.6 /100 | #244 | Tragic 7.2% |
| Immigrants | Cambodia | 0.5 /100 | #245 | Tragic 7.2% |
| Nicaraguans | 0.5 /100 | #246 | Tragic 7.2% |
| Dutch West Indians | 0.4 /100 | #247 | Tragic 7.3% |
| Spanish American Indians | 0.4 /100 | #248 | Tragic 7.3% |
| Bermudans | 0.4 /100 | #249 | Tragic 7.3% |
| Immigrants | Africa | 0.4 /100 | #250 | Tragic 7.3% |
| Malaysians | 0.3 /100 | #251 | Tragic 7.3% |