Norwegian vs German Russian Single Mother Households

COMPARE

Norwegian
Race
Ancestry
AfghanAfricanAlaska NativeAlaskan AthabascanAlbanianAleutAlsatianAmericanApacheArabArapahoArgentineanArmenianAssyrian/Chaldean/SyriacAustralianAustrianBahamianBangladeshiBarbadianBasqueBelgianBelizeanBermudanBhutaneseBlackfeetBolivianBrazilianBritishBritish West IndianBulgarianBurmeseCajunCambodianCanadianCape VerdeanCarpatho RusynCelticCentral AmericanCentral American IndianCherokeeCheyenneChickasawChileanChineseChippewaChoctawColombianColvilleComancheCosta RicanCreeCreekCroatianCrowCubanCypriotCzechCzechoslovakianDanishDelawareDominicanDutchDutch West IndianEastern EuropeanEcuadorianEgyptianEnglishEstonianEthiopianEuropeanFijianFilipinoFinnishFrenchFrench American IndianFrench CanadianGermanGhanaianGreekGuamanian/ChamorroGuatemalanGuyaneseHaitianHmongHonduranHopiHoumaHungarianIcelanderIndian (Asian)IndonesianInupiatIranianIraqiIrishIroquoisIsraeliItalianJamaicanJapaneseJordanianKenyanKiowaKoreanLaotianLatvianLebaneseLiberianLithuanianLumbeeLuxembourgerMacedonianMalaysianMalteseMarshalleseMenomineeMexicanMexican American IndianMongolianMoroccanNative HawaiianNavajoNepaleseNew ZealanderNicaraguanNigerianNorthern EuropeanNorwegianOkinawanOsageOttawaPaiutePakistaniPalestinianPanamanianParaguayanPennsylvania GermanPeruvianPimaPolishPortuguesePotawatomiPuebloPuerto RicanPuget Sound SalishRomanianRussianSalvadoranSamoanScandinavianScotch-IrishScottishSeminoleSenegaleseSerbianShoshoneSierra LeoneanSiouxSlavicSlovakSloveneSomaliSouth AfricanSouth AmericanSouth American IndianSoviet UnionSpaniardSpanishSpanish AmericanSpanish American IndianSri LankanSubsaharan AfricanSudaneseSwedishSwissSyrianTaiwaneseThaiTlingit-HaidaTohono O'OdhamTonganTrinidadian and TobagonianTsimshianTurkishU.S. Virgin IslanderUgandanUkrainianUruguayanUteVenezuelanVietnameseWelshWest IndianYakamaYaquiYugoslavianYumanYup'ikZimbabwean
Immigration
NonimmigrantsImmigrantsAfghanistanAfricaAlbaniaArgentinaArmeniaAsiaAustraliaAustriaBahamasBangladeshBarbadosBelarusBelgiumBelizeBoliviaBosnia and HerzegovinaBrazilBulgariaBurma/MyanmarCabo VerdeCambodiaCameroonCanadaCaribbeanCentral AmericaChileChinaColombiaCongoCosta RicaCroatiaCubaCzechoslovakiaDenmarkDominicaDominican RepublicEastern AfricaEastern AsiaEastern EuropeEcuadorEgyptEl SalvadorEnglandEritreaEthiopiaEuropeFijiFranceGermanyGhanaGreeceGrenadaGuatemalaGuyanaHaitiHondurasHong KongHungaryIndiaIndonesiaIranIraqIrelandIsraelItalyJamaicaJapanJordanKazakhstanKenyaKoreaKuwaitLaosLatin AmericaLatviaLebanonLiberiaLithuaniaMalaysiaMexicoMicronesiaMiddle AfricaMoldovaMoroccoNepalNetherlandsNicaraguaNigeriaNorth AmericaNorth MacedoniaNorthern AfricaNorthern EuropeNorwayOceaniaPakistanPanamaPeruPhilippinesPolandPortugalRomaniaRussiaSaudi ArabiaScotlandSenegalSerbiaSierra LeoneSingaporeSomaliaSouth AfricaSouth AmericaSouth Central AsiaSouth Eastern AsiaSouthern EuropeSpainSri LankaSt. Vincent and the GrenadinesSudanSwedenSwitzerlandSyriaTaiwanThailandTrinidad and TobagoTurkeyUgandaUkraineUruguayUzbekistanVenezuelaVietnamWest IndiesWestern AfricaWestern AsiaWestern EuropeYemenZaireZimbabweAzores
German Russian
Race
Ancestry
AfghanAfricanAlaska NativeAlaskan AthabascanAlbanianAleutAlsatianAmericanApacheArabArapahoArgentineanArmenianAssyrian/Chaldean/SyriacAustralianAustrianBahamianBangladeshiBarbadianBasqueBelgianBelizeanBermudanBhutaneseBlackfeetBolivianBrazilianBritishBritish West IndianBulgarianBurmeseCajunCambodianCanadianCape VerdeanCarpatho RusynCelticCentral AmericanCentral American IndianCherokeeCheyenneChickasawChileanChineseChippewaChoctawColombianColvilleComancheCosta RicanCreeCreekCroatianCrowCubanCypriotCzechCzechoslovakianDanishDelawareDominicanDutchDutch West IndianEastern EuropeanEcuadorianEgyptianEnglishEstonianEthiopianEuropeanFijianFilipinoFinnishFrenchFrench American IndianFrench CanadianGermanGerman RussianGhanaianGreekGuamanian/ChamorroGuatemalanGuyaneseHaitianHmongHonduranHopiHoumaHungarianIcelanderIndian (Asian)IndonesianInupiatIranianIraqiIrishIroquoisIsraeliItalianJamaicanJapaneseJordanianKenyanKiowaKoreanLaotianLatvianLebaneseLiberianLithuanianLumbeeLuxembourgerMacedonianMalaysianMalteseMarshalleseMenomineeMexicanMexican American IndianMongolianMoroccanNative HawaiianNavajoNepaleseNew ZealanderNicaraguanNigerianNorthern EuropeanOkinawanOsageOttawaPaiutePakistaniPalestinianPanamanianParaguayanPennsylvania GermanPeruvianPimaPolishPortuguesePotawatomiPuebloPuerto RicanPuget Sound SalishRomanianRussianSalvadoranSamoanScandinavianScotch-IrishScottishSeminoleSenegaleseSerbianShoshoneSierra LeoneanSiouxSlavicSlovakSloveneSomaliSouth AfricanSouth AmericanSouth American IndianSoviet UnionSpaniardSpanishSpanish AmericanSpanish American IndianSri LankanSubsaharan AfricanSudaneseSwedishSwissSyrianTaiwaneseThaiTlingit-HaidaTohono O'OdhamTonganTrinidadian and TobagonianTsimshianTurkishU.S. Virgin IslanderUgandanUkrainianUruguayanUteVenezuelanVietnameseWelshWest IndianYakamaYaquiYugoslavianYumanYup'ikZimbabwean
Immigration
NonimmigrantsImmigrantsAfghanistanAfricaAlbaniaArgentinaArmeniaAsiaAustraliaAustriaBahamasBangladeshBarbadosBelarusBelgiumBelizeBoliviaBosnia and HerzegovinaBrazilBulgariaBurma/MyanmarCabo VerdeCambodiaCameroonCanadaCaribbeanCentral AmericaChileChinaColombiaCongoCosta RicaCroatiaCubaCzechoslovakiaDenmarkDominicaDominican RepublicEastern AfricaEastern AsiaEastern EuropeEcuadorEgyptEl SalvadorEnglandEritreaEthiopiaEuropeFijiFranceGermanyGhanaGreeceGrenadaGuatemalaGuyanaHaitiHondurasHong KongHungaryIndiaIndonesiaIranIraqIrelandIsraelItalyJamaicaJapanJordanKazakhstanKenyaKoreaKuwaitLaosLatin AmericaLatviaLebanonLiberiaLithuaniaMalaysiaMexicoMicronesiaMiddle AfricaMoldovaMoroccoNepalNetherlandsNicaraguaNigeriaNorth AmericaNorth MacedoniaNorthern AfricaNorthern EuropeNorwayOceaniaPakistanPanamaPeruPhilippinesPolandPortugalRomaniaRussiaSaudi ArabiaScotlandSenegalSerbiaSierra LeoneSingaporeSomaliaSouth AfricaSouth AmericaSouth Central AsiaSouth Eastern AsiaSouthern EuropeSpainSri LankaSt. Vincent and the GrenadinesSudanSwedenSwitzerlandSyriaTaiwanThailandTrinidad and TobagoTurkeyUgandaUkraineUruguayUzbekistanVenezuelaVietnamWest IndiesWestern AfricaWestern AsiaWestern EuropeYemenZaireZimbabweAzores
Single Mother Households
Income
Poverty
Unemployment
Labor Participation
Family Structure
Vehicle Availability
Education Level
Disability

Single Mother Households Comparison

Norwegians

German Russians

Exceptional
Poor
5.5%
SINGLE MOTHER HOUSEHOLDS
99.3/ 100
METRIC RATING
47th/ 347
METRIC RANK
6.7%
SINGLE MOTHER HOUSEHOLDS
11.5/ 100
METRIC RATING
206th/ 347
METRIC RANK

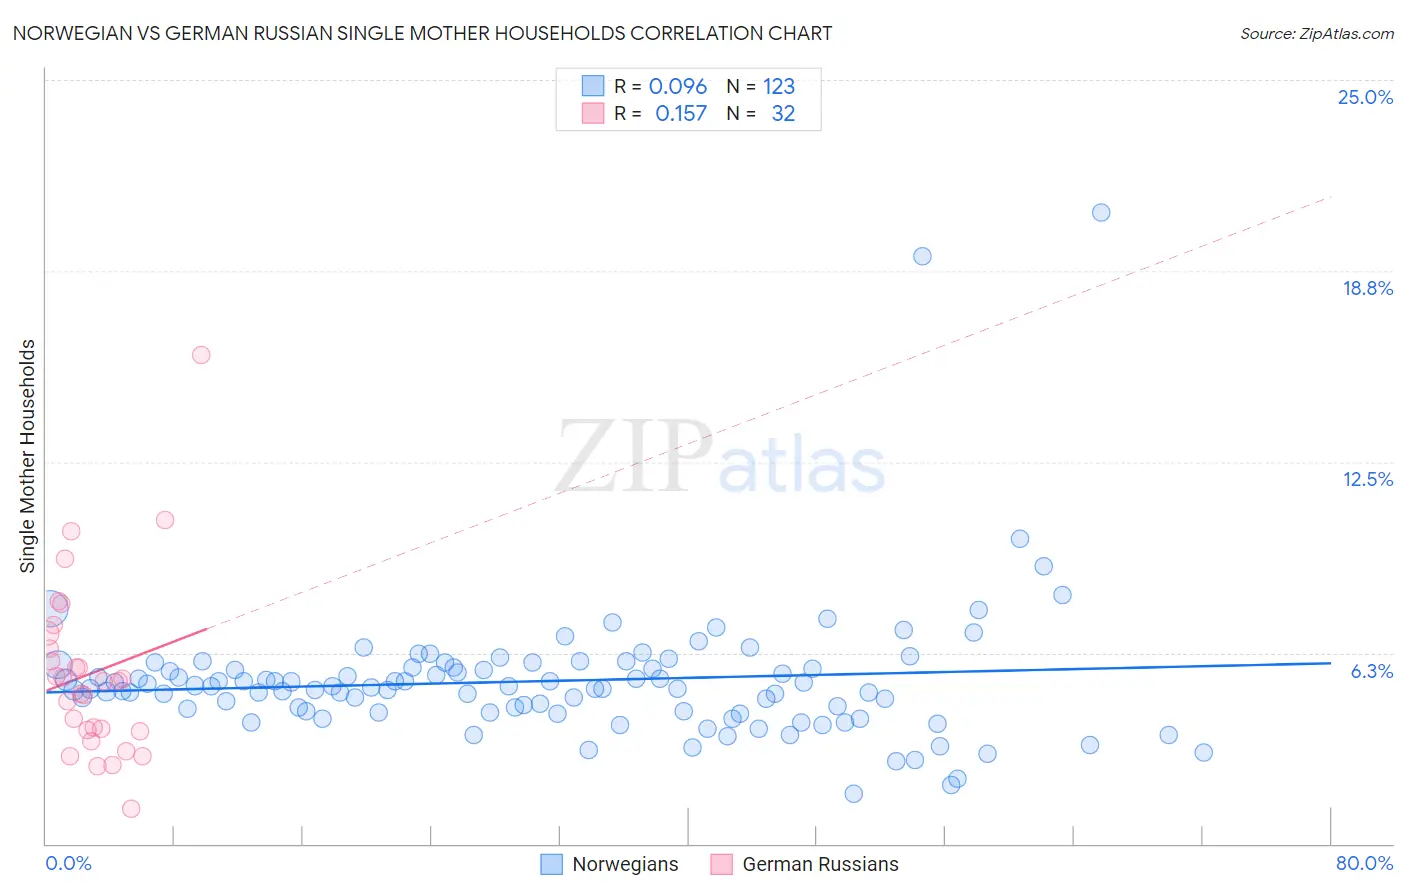
Norwegian vs German Russian Single Mother Households Correlation Chart

The statistical analysis conducted on geographies consisting of 529,367,930 people shows a slight positive correlation between the proportion of Norwegians and percentage of single mother households in the United States with a correlation coefficient (R) of 0.096 and weighted average of 5.5%. Similarly, the statistical analysis conducted on geographies consisting of 96,402,905 people shows a poor positive correlation between the proportion of German Russians and percentage of single mother households in the United States with a correlation coefficient (R) of 0.157 and weighted average of 6.7%, a difference of 21.9%.
Norwegian vs German Russian Single Mother Households

Single Mother Households Correlation Summary

MeasurementNorwegianGerman Russian
Minimum1.6%1.1%
Maximum20.7%16.0%
Range19.0%14.9%
Mean5.3%5.6%
Median5.1%5.3%
Interquartile 25% (IQ1)4.3%3.7%
Interquartile 75% (IQ3)5.8%6.6%
Interquartile Range (IQR)1.4%2.9%
Standard Deviation (Sample)2.3%2.9%
Standard Deviation (Population)2.3%2.9%

Similar Demographics by Single Mother Households

Demographics Similar to Norwegians by Single Mother Households

In terms of single mother households, the demographic groups most similar to Norwegians are Croatian (5.5%, a difference of 0.18%), Turkish (5.5%, a difference of 0.20%), Immigrants from Latvia (5.5%, a difference of 0.23%), Immigrants from Scotland (5.5%, a difference of 0.42%), and Immigrants from Croatia (5.4%, a difference of 0.44%).
DemographicsRating | RankSingle Mother Households
Estonians
99.6
/100
|
#40
Exceptional
5.4%
Immigrants | Greece
99.5
/100
|
#41
Exceptional
5.4%
Macedonians
99.5
/100
|
#42
Exceptional
5.4%
Immigrants | South Central Asia
99.5
/100
|
#43
Exceptional
5.4%
Lithuanians
99.4
/100
|
#44
Exceptional
5.4%
Immigrants | Croatia
99.4
/100
|
#45
Exceptional
5.4%
Croatians
99.3
/100
|
#46
Exceptional
5.5%
Norwegians
99.3
/100
|
#47
Exceptional
5.5%
Turks
99.2
/100
|
#48
Exceptional
5.5%
Immigrants | Latvia
99.2
/100
|
#49
Exceptional
5.5%
Immigrants | Scotland
99.2
/100
|
#50
Exceptional
5.5%
Immigrants | Belarus
99.2
/100
|
#51
Exceptional
5.5%
Swedes
99.1
/100
|
#52
Exceptional
5.5%
Immigrants | Russia
99.1
/100
|
#53
Exceptional
5.5%
Immigrants | Lebanon
99.1
/100
|
#54
Exceptional
5.5%

Demographics Similar to German Russians by Single Mother Households

In terms of single mother households, the demographic groups most similar to German Russians are Immigrants from South America (6.7%, a difference of 0.0%), Vietnamese (6.7%, a difference of 0.050%), Cree (6.7%, a difference of 0.080%), Immigrants from Fiji (6.7%, a difference of 0.10%), and Immigrants from Peru (6.7%, a difference of 0.11%).
DemographicsRating | RankSingle Mother Households
Potawatomi
15.5
/100
|
#199
Poor
6.6%
Immigrants | Ethiopia
14.7
/100
|
#200
Poor
6.6%
Venezuelans
12.9
/100
|
#201
Poor
6.6%
Guamanians/Chamorros
12.4
/100
|
#202
Poor
6.6%
Immigrants | Peru
12.0
/100
|
#203
Poor
6.7%
Immigrants | Fiji
11.9
/100
|
#204
Poor
6.7%
Cree
11.9
/100
|
#205
Poor
6.7%
German Russians
11.5
/100
|
#206
Poor
6.7%
Immigrants | South America
11.5
/100
|
#207
Poor
6.7%
Vietnamese
11.3
/100
|
#208
Poor
6.7%
Immigrants | Colombia
10.5
/100
|
#209
Poor
6.7%
Immigrants | Nonimmigrants
10.4
/100
|
#210
Poor
6.7%
Immigrants | Venezuela
8.5
/100
|
#211
Tragic
6.7%
Immigrants | Eritrea
8.4
/100
|
#212
Tragic
6.7%
Immigrants | Costa Rica
8.2
/100
|
#213
Tragic
6.7%