Norwegian vs British Single Mother Households
COMPARE
Norwegian
British
Single Mother Households
Single Mother Households Comparison
Norwegians
British
5.5%
SINGLE MOTHER HOUSEHOLDS
99.3/ 100
METRIC RATING
47th/ 347
METRIC RANK
5.8%
SINGLE MOTHER HOUSEHOLDS
95.5/ 100
METRIC RATING
110th/ 347
METRIC RANK
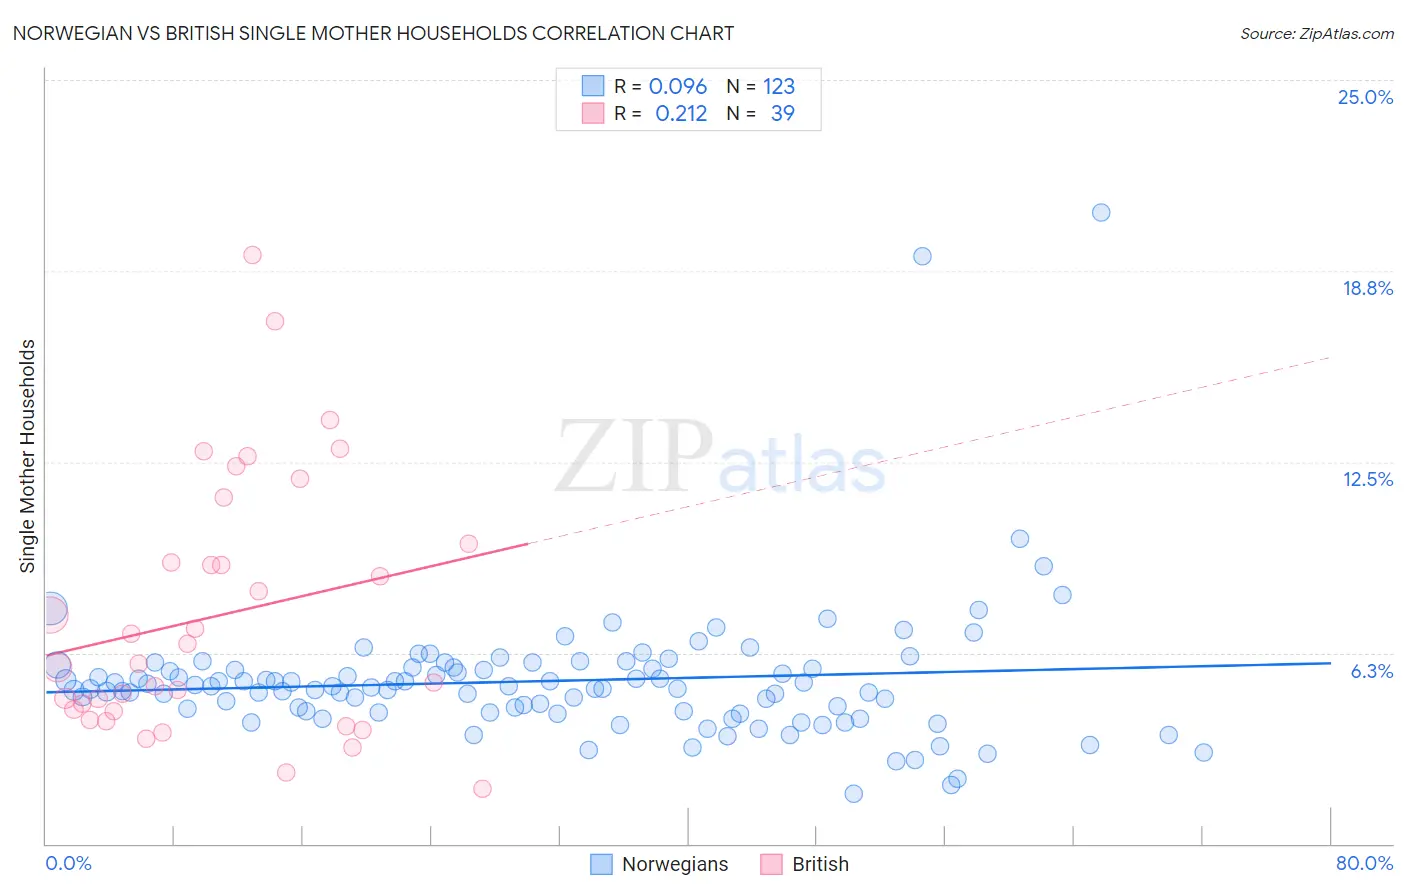
Norwegian vs British Single Mother Households Correlation Chart
The statistical analysis conducted on geographies consisting of 529,367,930 people shows a slight positive correlation between the proportion of Norwegians and percentage of single mother households in the United States with a correlation coefficient (R) of 0.096 and weighted average of 5.5%. Similarly, the statistical analysis conducted on geographies consisting of 528,132,597 people shows a weak positive correlation between the proportion of British and percentage of single mother households in the United States with a correlation coefficient (R) of 0.212 and weighted average of 5.8%, a difference of 5.8%.
Single Mother Households Correlation Summary
| Measurement | Norwegian | British |
| Minimum | 1.6% | 1.8% |
| Maximum | 20.7% | 19.3% |
| Range | 19.0% | 17.5% |
| Mean | 5.3% | 7.5% |
| Median | 5.1% | 5.9% |
| Interquartile 25% (IQ1) | 4.3% | 4.3% |
| Interquartile 75% (IQ3) | 5.8% | 9.8% |
| Interquartile Range (IQR) | 1.4% | 5.5% |
| Standard Deviation (Sample) | 2.3% | 4.2% |
| Standard Deviation (Population) | 2.3% | 4.1% |
Similar Demographics by Single Mother Households
Demographics Similar to Norwegians by Single Mother Households
In terms of single mother households, the demographic groups most similar to Norwegians are Croatian (5.5%, a difference of 0.18%), Turkish (5.5%, a difference of 0.20%), Immigrants from Latvia (5.5%, a difference of 0.23%), Immigrants from Scotland (5.5%, a difference of 0.42%), and Immigrants from Croatia (5.4%, a difference of 0.44%).
| Demographics | Rating | Rank | Single Mother Households |
| Estonians | 99.6 /100 | #40 | Exceptional 5.4% |
| Immigrants | Greece | 99.5 /100 | #41 | Exceptional 5.4% |
| Macedonians | 99.5 /100 | #42 | Exceptional 5.4% |
| Immigrants | South Central Asia | 99.5 /100 | #43 | Exceptional 5.4% |
| Lithuanians | 99.4 /100 | #44 | Exceptional 5.4% |
| Immigrants | Croatia | 99.4 /100 | #45 | Exceptional 5.4% |
| Croatians | 99.3 /100 | #46 | Exceptional 5.5% |
| Norwegians | 99.3 /100 | #47 | Exceptional 5.5% |
| Turks | 99.2 /100 | #48 | Exceptional 5.5% |
| Immigrants | Latvia | 99.2 /100 | #49 | Exceptional 5.5% |
| Immigrants | Scotland | 99.2 /100 | #50 | Exceptional 5.5% |
| Immigrants | Belarus | 99.2 /100 | #51 | Exceptional 5.5% |
| Swedes | 99.1 /100 | #52 | Exceptional 5.5% |
| Immigrants | Russia | 99.1 /100 | #53 | Exceptional 5.5% |
| Immigrants | Lebanon | 99.1 /100 | #54 | Exceptional 5.5% |
Demographics Similar to British by Single Mother Households
In terms of single mother households, the demographic groups most similar to British are Immigrants from England (5.8%, a difference of 0.030%), Immigrants from Kuwait (5.8%, a difference of 0.070%), Immigrants from Western Europe (5.8%, a difference of 0.090%), Mongolian (5.8%, a difference of 0.14%), and Immigrants from Italy (5.8%, a difference of 0.18%).
| Demographics | Rating | Rank | Single Mother Households |
| Scottish | 96.2 /100 | #103 | Exceptional 5.8% |
| Northern Europeans | 96.2 /100 | #104 | Exceptional 5.8% |
| Taiwanese | 96.1 /100 | #105 | Exceptional 5.8% |
| Immigrants | Ukraine | 95.9 /100 | #106 | Exceptional 5.8% |
| Paraguayans | 95.8 /100 | #107 | Exceptional 5.8% |
| Immigrants | Italy | 95.8 /100 | #108 | Exceptional 5.8% |
| Immigrants | Western Europe | 95.7 /100 | #109 | Exceptional 5.8% |
| British | 95.5 /100 | #110 | Exceptional 5.8% |
| Immigrants | England | 95.5 /100 | #111 | Exceptional 5.8% |
| Immigrants | Kuwait | 95.4 /100 | #112 | Exceptional 5.8% |
| Mongolians | 95.3 /100 | #113 | Exceptional 5.8% |
| Dutch | 95.1 /100 | #114 | Exceptional 5.8% |
| Irish | 94.8 /100 | #115 | Exceptional 5.8% |
| Pennsylvania Germans | 94.7 /100 | #116 | Exceptional 5.8% |
| Bolivians | 94.6 /100 | #117 | Exceptional 5.8% |