Immigrants from Singapore vs Cuban Single Mother Households
COMPARE
Immigrants from Singapore
Cuban
Single Mother Households
Single Mother Households Comparison
Immigrants from Singapore
Cubans
5.0%
SINGLE MOTHER HOUSEHOLDS
100.0/ 100
METRIC RATING
6th/ 347
METRIC RANK
7.2%
SINGLE MOTHER HOUSEHOLDS
0.6/ 100
METRIC RATING
244th/ 347
METRIC RANK
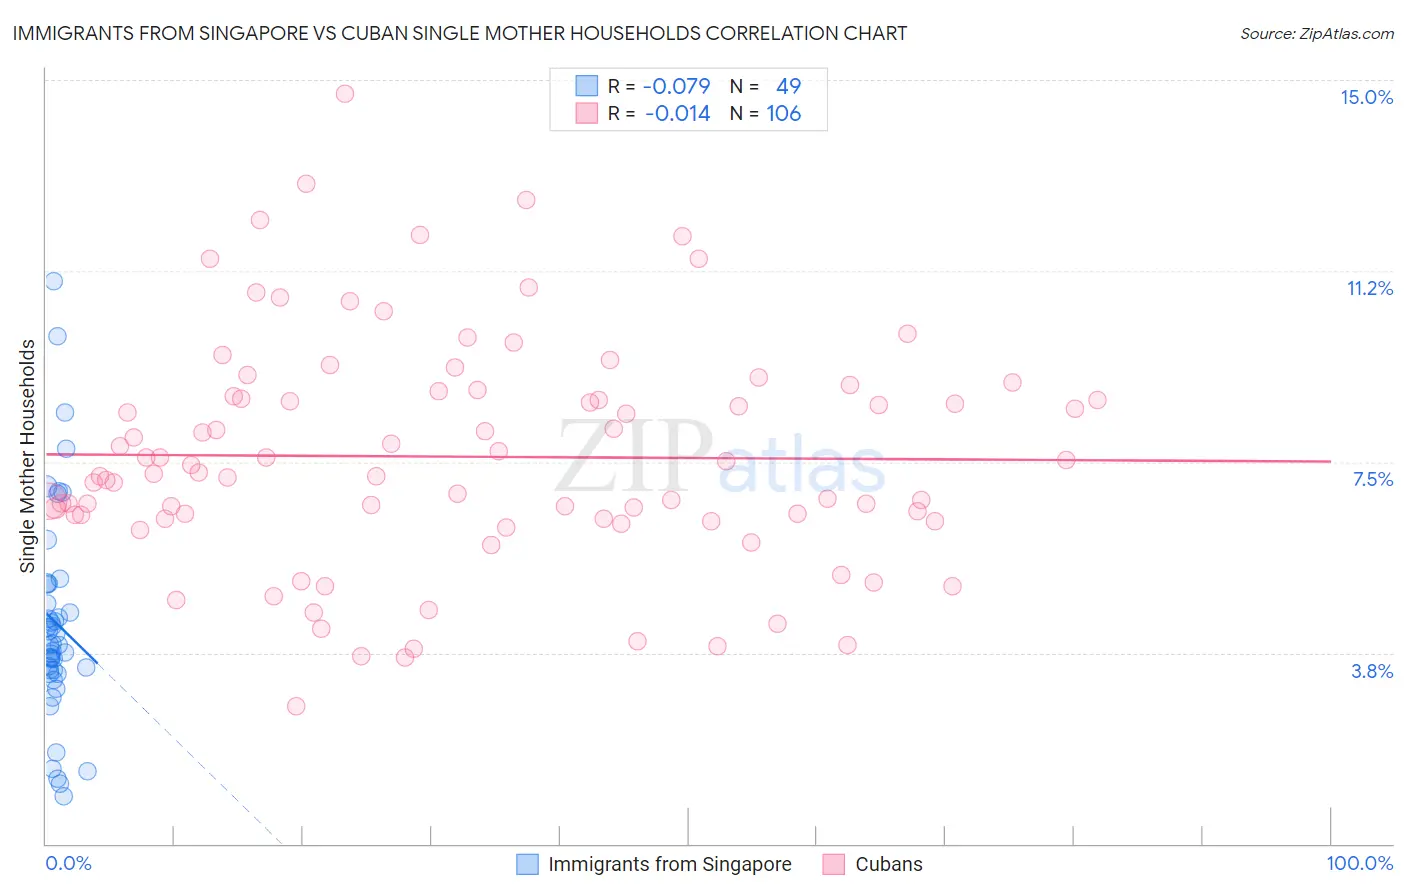
Immigrants from Singapore vs Cuban Single Mother Households Correlation Chart
The statistical analysis conducted on geographies consisting of 137,315,174 people shows a slight negative correlation between the proportion of Immigrants from Singapore and percentage of single mother households in the United States with a correlation coefficient (R) of -0.079 and weighted average of 5.0%. Similarly, the statistical analysis conducted on geographies consisting of 447,599,583 people shows no correlation between the proportion of Cubans and percentage of single mother households in the United States with a correlation coefficient (R) of -0.014 and weighted average of 7.2%, a difference of 45.2%.
Single Mother Households Correlation Summary
| Measurement | Immigrants from Singapore | Cuban |
| Minimum | 0.93% | 2.7% |
| Maximum | 11.0% | 14.7% |
| Range | 10.1% | 12.0% |
| Mean | 4.3% | 7.6% |
| Median | 3.9% | 7.3% |
| Interquartile 25% (IQ1) | 3.4% | 6.4% |
| Interquartile 75% (IQ3) | 5.1% | 8.8% |
| Interquartile Range (IQR) | 1.7% | 2.4% |
| Standard Deviation (Sample) | 2.1% | 2.3% |
| Standard Deviation (Population) | 2.1% | 2.2% |
Similar Demographics by Single Mother Households
Demographics Similar to Immigrants from Singapore by Single Mother Households
In terms of single mother households, the demographic groups most similar to Immigrants from Singapore are Iranian (5.0%, a difference of 0.25%), Immigrants from Ireland (5.0%, a difference of 0.91%), Okinawan (5.0%, a difference of 1.1%), Immigrants from Israel (5.0%, a difference of 1.4%), and Immigrants from China (5.1%, a difference of 2.0%).
| Demographics | Rating | Rank | Single Mother Households |
| Immigrants | Taiwan | 100.0 /100 | #1 | Exceptional 4.7% |
| Filipinos | 100.0 /100 | #2 | Exceptional 4.7% |
| Immigrants | Iran | 100.0 /100 | #3 | Exceptional 4.8% |
| Assyrians/Chaldeans/Syriacs | 100.0 /100 | #4 | Exceptional 4.8% |
| Immigrants | Hong Kong | 100.0 /100 | #5 | Exceptional 4.8% |
| Immigrants | Singapore | 100.0 /100 | #6 | Exceptional 5.0% |
| Iranians | 100.0 /100 | #7 | Exceptional 5.0% |
| Immigrants | Ireland | 99.9 /100 | #8 | Exceptional 5.0% |
| Okinawans | 99.9 /100 | #9 | Exceptional 5.0% |
| Immigrants | Israel | 99.9 /100 | #10 | Exceptional 5.0% |
| Immigrants | China | 99.9 /100 | #11 | Exceptional 5.1% |
| Cypriots | 99.9 /100 | #12 | Exceptional 5.1% |
| Immigrants | India | 99.9 /100 | #13 | Exceptional 5.1% |
| Immigrants | Australia | 99.9 /100 | #14 | Exceptional 5.1% |
| Immigrants | Eastern Asia | 99.9 /100 | #15 | Exceptional 5.1% |
Demographics Similar to Cubans by Single Mother Households
In terms of single mother households, the demographic groups most similar to Cubans are Ecuadorian (7.2%, a difference of 0.070%), Fijian (7.2%, a difference of 0.11%), Immigrants from Portugal (7.2%, a difference of 0.19%), Immigrants from Cambodia (7.2%, a difference of 0.34%), and Nicaraguan (7.2%, a difference of 0.53%).
| Demographics | Rating | Rank | Single Mother Households |
| Arapaho | 1.0 /100 | #237 | Tragic 7.1% |
| Panamanians | 0.9 /100 | #238 | Tragic 7.1% |
| Kiowa | 0.8 /100 | #239 | Tragic 7.1% |
| Immigrants | Panama | 0.7 /100 | #240 | Tragic 7.2% |
| Immigrants | Portugal | 0.6 /100 | #241 | Tragic 7.2% |
| Fijians | 0.6 /100 | #242 | Tragic 7.2% |
| Ecuadorians | 0.6 /100 | #243 | Tragic 7.2% |
| Cubans | 0.6 /100 | #244 | Tragic 7.2% |
| Immigrants | Cambodia | 0.5 /100 | #245 | Tragic 7.2% |
| Nicaraguans | 0.5 /100 | #246 | Tragic 7.2% |
| Dutch West Indians | 0.4 /100 | #247 | Tragic 7.3% |
| Spanish American Indians | 0.4 /100 | #248 | Tragic 7.3% |
| Bermudans | 0.4 /100 | #249 | Tragic 7.3% |
| Immigrants | Africa | 0.4 /100 | #250 | Tragic 7.3% |
| Malaysians | 0.3 /100 | #251 | Tragic 7.3% |