Norwegian vs Cuban Vision Disability
COMPARE
Norwegian
Cuban
Vision Disability
Vision Disability Comparison
Norwegians
Cubans
2.0%
VISION DISABILITY
97.0/ 100
METRIC RATING
88th/ 347
METRIC RANK
2.4%
VISION DISABILITY
0.1/ 100
METRIC RATING
270th/ 347
METRIC RANK
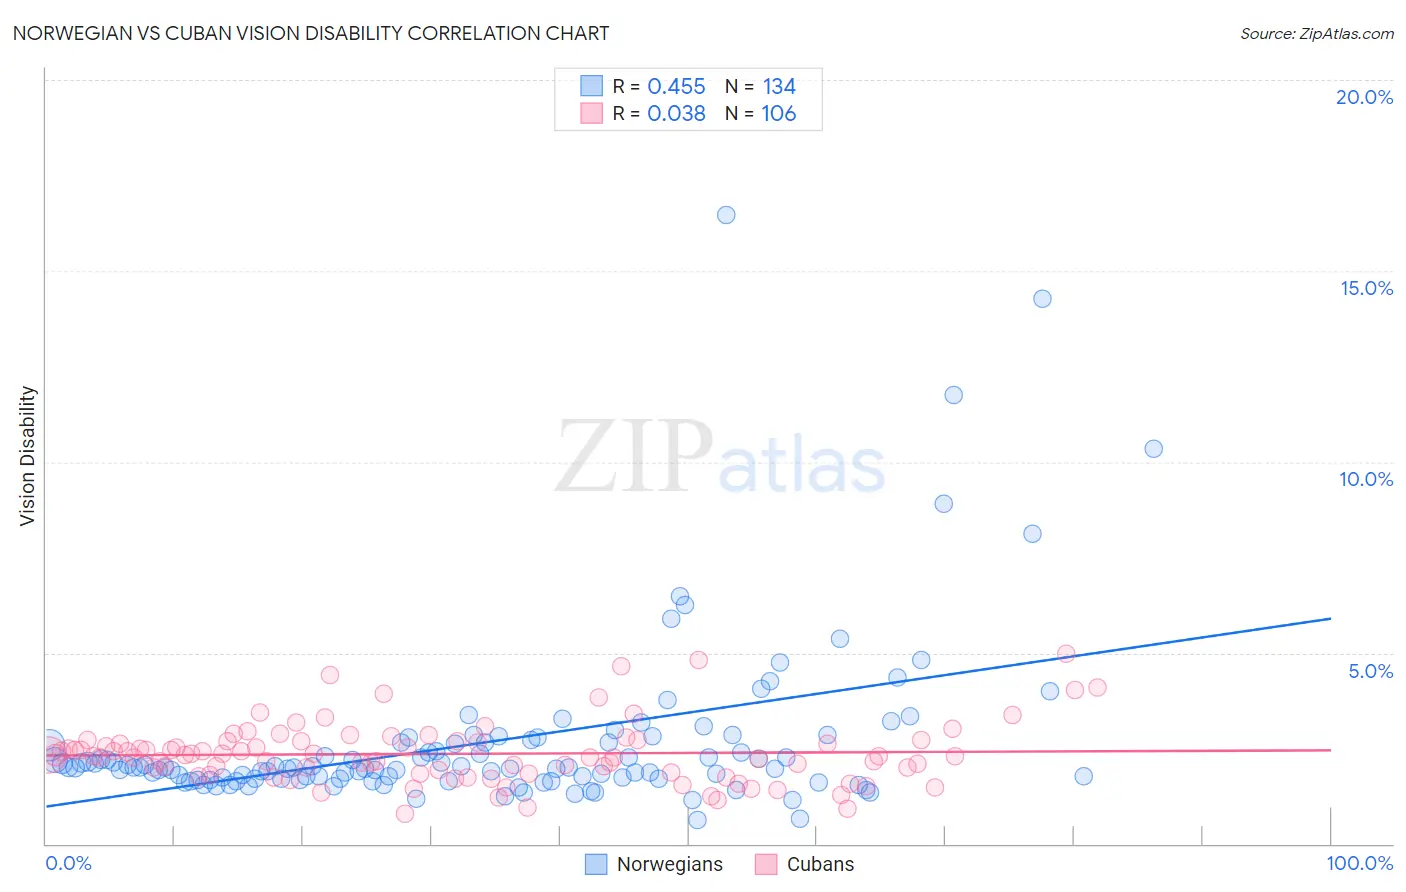
Norwegian vs Cuban Vision Disability Correlation Chart
The statistical analysis conducted on geographies consisting of 532,008,287 people shows a moderate positive correlation between the proportion of Norwegians and percentage of population with vision disability in the United States with a correlation coefficient (R) of 0.455 and weighted average of 2.0%. Similarly, the statistical analysis conducted on geographies consisting of 448,885,451 people shows no correlation between the proportion of Cubans and percentage of population with vision disability in the United States with a correlation coefficient (R) of 0.038 and weighted average of 2.4%, a difference of 17.6%.
Vision Disability Correlation Summary
| Measurement | Norwegian | Cuban |
| Minimum | 0.63% | 0.77% |
| Maximum | 16.5% | 5.0% |
| Range | 15.8% | 4.2% |
| Mean | 2.7% | 2.4% |
| Median | 2.0% | 2.3% |
| Interquartile 25% (IQ1) | 1.7% | 1.8% |
| Interquartile 75% (IQ3) | 2.7% | 2.7% |
| Interquartile Range (IQR) | 0.95% | 0.85% |
| Standard Deviation (Sample) | 2.3% | 0.80% |
| Standard Deviation (Population) | 2.3% | 0.79% |
Similar Demographics by Vision Disability
Demographics Similar to Norwegians by Vision Disability
In terms of vision disability, the demographic groups most similar to Norwegians are Immigrants from Switzerland (2.0%, a difference of 0.010%), Immigrants from Eastern Africa (2.0%, a difference of 0.040%), Immigrants from Moldova (2.0%, a difference of 0.070%), Chinese (2.0%, a difference of 0.10%), and Immigrants from Latvia (2.0%, a difference of 0.15%).
| Demographics | Rating | Rank | Vision Disability |
| Soviet Union | 97.6 /100 | #81 | Exceptional 2.0% |
| Immigrants | Poland | 97.6 /100 | #82 | Exceptional 2.0% |
| Immigrants | Western Asia | 97.5 /100 | #83 | Exceptional 2.0% |
| Immigrants | Latvia | 97.3 /100 | #84 | Exceptional 2.0% |
| Chinese | 97.2 /100 | #85 | Exceptional 2.0% |
| Immigrants | Moldova | 97.2 /100 | #86 | Exceptional 2.0% |
| Immigrants | Switzerland | 97.0 /100 | #87 | Exceptional 2.0% |
| Norwegians | 97.0 /100 | #88 | Exceptional 2.0% |
| Immigrants | Eastern Africa | 97.0 /100 | #89 | Exceptional 2.0% |
| Immigrants | Lebanon | 96.7 /100 | #90 | Exceptional 2.1% |
| Immigrants | Somalia | 96.2 /100 | #91 | Exceptional 2.1% |
| Immigrants | Syria | 96.2 /100 | #92 | Exceptional 2.1% |
| Immigrants | Europe | 96.1 /100 | #93 | Exceptional 2.1% |
| Immigrants | Croatia | 96.0 /100 | #94 | Exceptional 2.1% |
| Australians | 95.9 /100 | #95 | Exceptional 2.1% |
Demographics Similar to Cubans by Vision Disability
In terms of vision disability, the demographic groups most similar to Cubans are Celtic (2.4%, a difference of 0.010%), Immigrants from the Azores (2.4%, a difference of 0.16%), Spaniard (2.4%, a difference of 0.26%), Senegalese (2.4%, a difference of 0.28%), and Ute (2.4%, a difference of 0.37%).
| Demographics | Rating | Rank | Vision Disability |
| Immigrants | Belize | 0.1 /100 | #263 | Tragic 2.4% |
| Immigrants | Liberia | 0.1 /100 | #264 | Tragic 2.4% |
| Immigrants | Jamaica | 0.1 /100 | #265 | Tragic 2.4% |
| Mexican American Indians | 0.1 /100 | #266 | Tragic 2.4% |
| Ute | 0.1 /100 | #267 | Tragic 2.4% |
| Senegalese | 0.1 /100 | #268 | Tragic 2.4% |
| Celtics | 0.1 /100 | #269 | Tragic 2.4% |
| Cubans | 0.1 /100 | #270 | Tragic 2.4% |
| Immigrants | Azores | 0.1 /100 | #271 | Tragic 2.4% |
| Spaniards | 0.1 /100 | #272 | Tragic 2.4% |
| Immigrants | Bahamas | 0.1 /100 | #273 | Tragic 2.4% |
| Immigrants | Latin America | 0.0 /100 | #274 | Tragic 2.4% |
| Chippewa | 0.0 /100 | #275 | Tragic 2.4% |
| Scotch-Irish | 0.0 /100 | #276 | Tragic 2.4% |
| Bahamians | 0.0 /100 | #277 | Tragic 2.4% |