Immigrants from Argentina vs Trinidadian and Tobagonian Single Mother Households
COMPARE
Immigrants from Argentina
Trinidadian and Tobagonian
Single Mother Households
Single Mother Households Comparison
Immigrants from Argentina
Trinidadians and Tobagonians
5.9%
SINGLE MOTHER HOUSEHOLDS
93.2/ 100
METRIC RATING
124th/ 347
METRIC RANK
7.7%
SINGLE MOTHER HOUSEHOLDS
0.0/ 100
METRIC RATING
285th/ 347
METRIC RANK
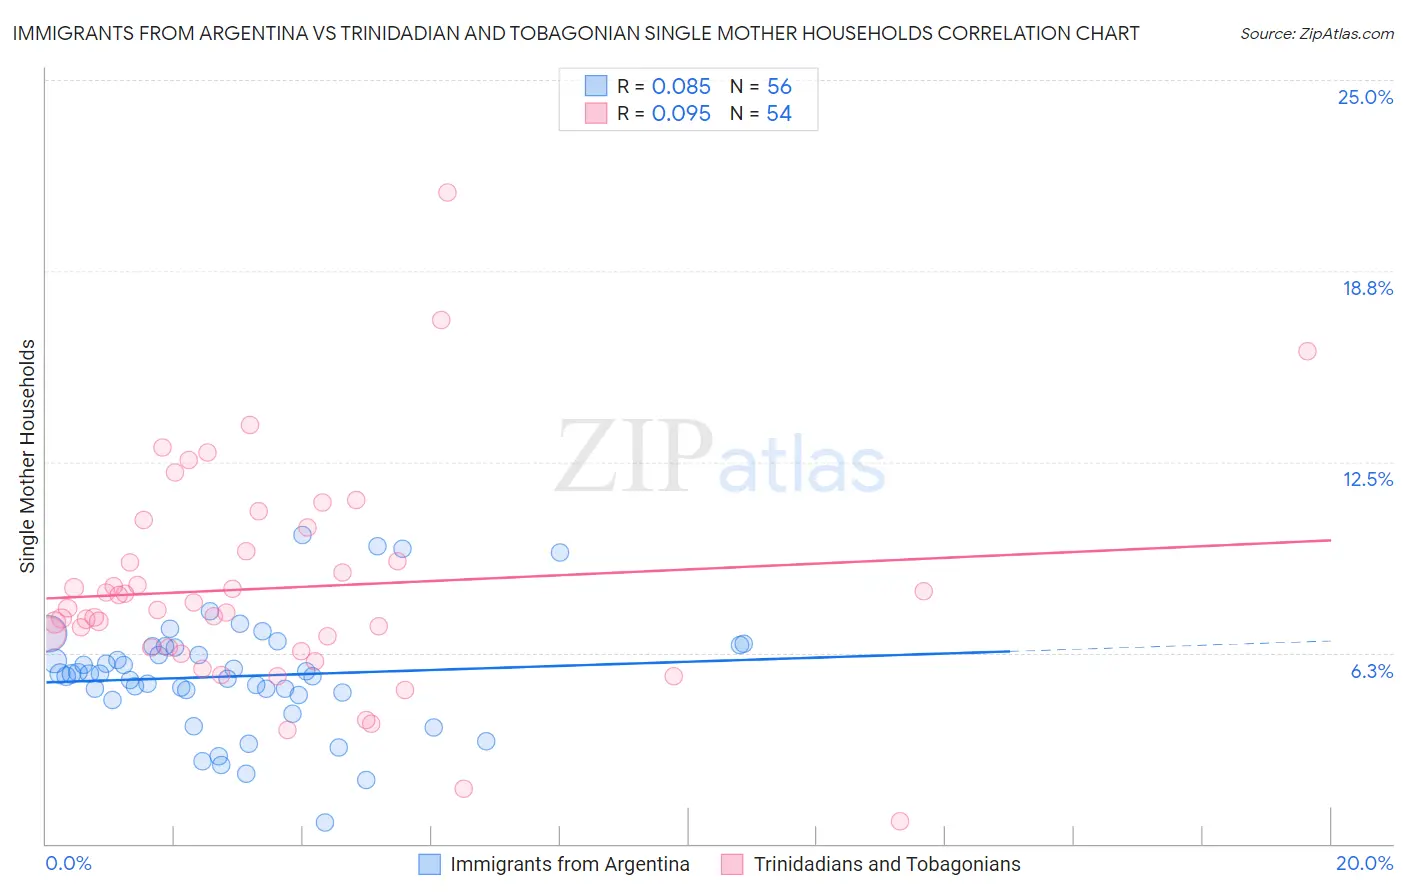
Immigrants from Argentina vs Trinidadian and Tobagonian Single Mother Households Correlation Chart
The statistical analysis conducted on geographies consisting of 263,950,870 people shows a slight positive correlation between the proportion of Immigrants from Argentina and percentage of single mother households in the United States with a correlation coefficient (R) of 0.085 and weighted average of 5.9%. Similarly, the statistical analysis conducted on geographies consisting of 219,557,612 people shows a slight positive correlation between the proportion of Trinidadians and Tobagonians and percentage of single mother households in the United States with a correlation coefficient (R) of 0.095 and weighted average of 7.7%, a difference of 31.7%.
Single Mother Households Correlation Summary
| Measurement | Immigrants from Argentina | Trinidadian and Tobagonian |
| Minimum | 0.70% | 0.73% |
| Maximum | 10.1% | 21.3% |
| Range | 9.4% | 20.6% |
| Mean | 5.5% | 8.4% |
| Median | 5.6% | 7.7% |
| Interquartile 25% (IQ1) | 4.9% | 6.4% |
| Interquartile 75% (IQ3) | 6.4% | 9.6% |
| Interquartile Range (IQR) | 1.5% | 3.2% |
| Standard Deviation (Sample) | 1.8% | 3.6% |
| Standard Deviation (Population) | 1.8% | 3.6% |
Similar Demographics by Single Mother Households
Demographics Similar to Immigrants from Argentina by Single Mother Households
In terms of single mother households, the demographic groups most similar to Immigrants from Argentina are Immigrants from Uzbekistan (5.9%, a difference of 0.070%), Belgian (5.8%, a difference of 0.13%), Slavic (5.9%, a difference of 0.16%), Welsh (5.9%, a difference of 0.18%), and Argentinean (5.8%, a difference of 0.21%).
| Demographics | Rating | Rank | Single Mother Households |
| Bolivians | 94.6 /100 | #117 | Exceptional 5.8% |
| Laotians | 94.3 /100 | #118 | Exceptional 5.8% |
| South Africans | 94.1 /100 | #119 | Exceptional 5.8% |
| Tongans | 93.7 /100 | #120 | Exceptional 5.8% |
| Argentineans | 93.7 /100 | #121 | Exceptional 5.8% |
| Belgians | 93.5 /100 | #122 | Exceptional 5.8% |
| Immigrants | Uzbekistan | 93.4 /100 | #123 | Exceptional 5.9% |
| Immigrants | Argentina | 93.2 /100 | #124 | Exceptional 5.9% |
| Slavs | 92.9 /100 | #125 | Exceptional 5.9% |
| Welsh | 92.8 /100 | #126 | Exceptional 5.9% |
| Lebanese | 92.4 /100 | #127 | Exceptional 5.9% |
| Czechoslovakians | 92.2 /100 | #128 | Exceptional 5.9% |
| Immigrants | Bolivia | 92.2 /100 | #129 | Exceptional 5.9% |
| Palestinians | 92.1 /100 | #130 | Exceptional 5.9% |
| Immigrants | Spain | 91.2 /100 | #131 | Exceptional 5.9% |
Demographics Similar to Trinidadians and Tobagonians by Single Mother Households
In terms of single mother households, the demographic groups most similar to Trinidadians and Tobagonians are Immigrants from Belize (7.7%, a difference of 0.030%), Immigrants from Middle Africa (7.7%, a difference of 0.11%), Immigrants from Guatemala (7.7%, a difference of 0.21%), Sierra Leonean (7.7%, a difference of 0.26%), and Nigerian (7.7%, a difference of 0.63%).
| Demographics | Rating | Rank | Single Mother Households |
| Central Americans | 0.1 /100 | #278 | Tragic 7.6% |
| Immigrants | El Salvador | 0.0 /100 | #279 | Tragic 7.6% |
| Immigrants | Sierra Leone | 0.0 /100 | #280 | Tragic 7.7% |
| Immigrants | Laos | 0.0 /100 | #281 | Tragic 7.7% |
| Guatemalans | 0.0 /100 | #282 | Tragic 7.7% |
| Nigerians | 0.0 /100 | #283 | Tragic 7.7% |
| Immigrants | Belize | 0.0 /100 | #284 | Tragic 7.7% |
| Trinidadians and Tobagonians | 0.0 /100 | #285 | Tragic 7.7% |
| Immigrants | Middle Africa | 0.0 /100 | #286 | Tragic 7.7% |
| Immigrants | Guatemala | 0.0 /100 | #287 | Tragic 7.7% |
| Sierra Leoneans | 0.0 /100 | #288 | Tragic 7.7% |
| Sub-Saharan Africans | 0.0 /100 | #289 | Tragic 7.8% |
| Immigrants | Nigeria | 0.0 /100 | #290 | Tragic 7.8% |
| West Indians | 0.0 /100 | #291 | Tragic 7.8% |
| Ghanaians | 0.0 /100 | #292 | Tragic 7.8% |