Nepalese vs West Indian Single Mother Households
COMPARE
Nepalese
West Indian
Single Mother Households
Single Mother Households Comparison
Nepalese
West Indians
7.5%
SINGLE MOTHER HOUSEHOLDS
0.1/ 100
METRIC RATING
266th/ 347
METRIC RANK
7.8%
SINGLE MOTHER HOUSEHOLDS
0.0/ 100
METRIC RATING
291st/ 347
METRIC RANK
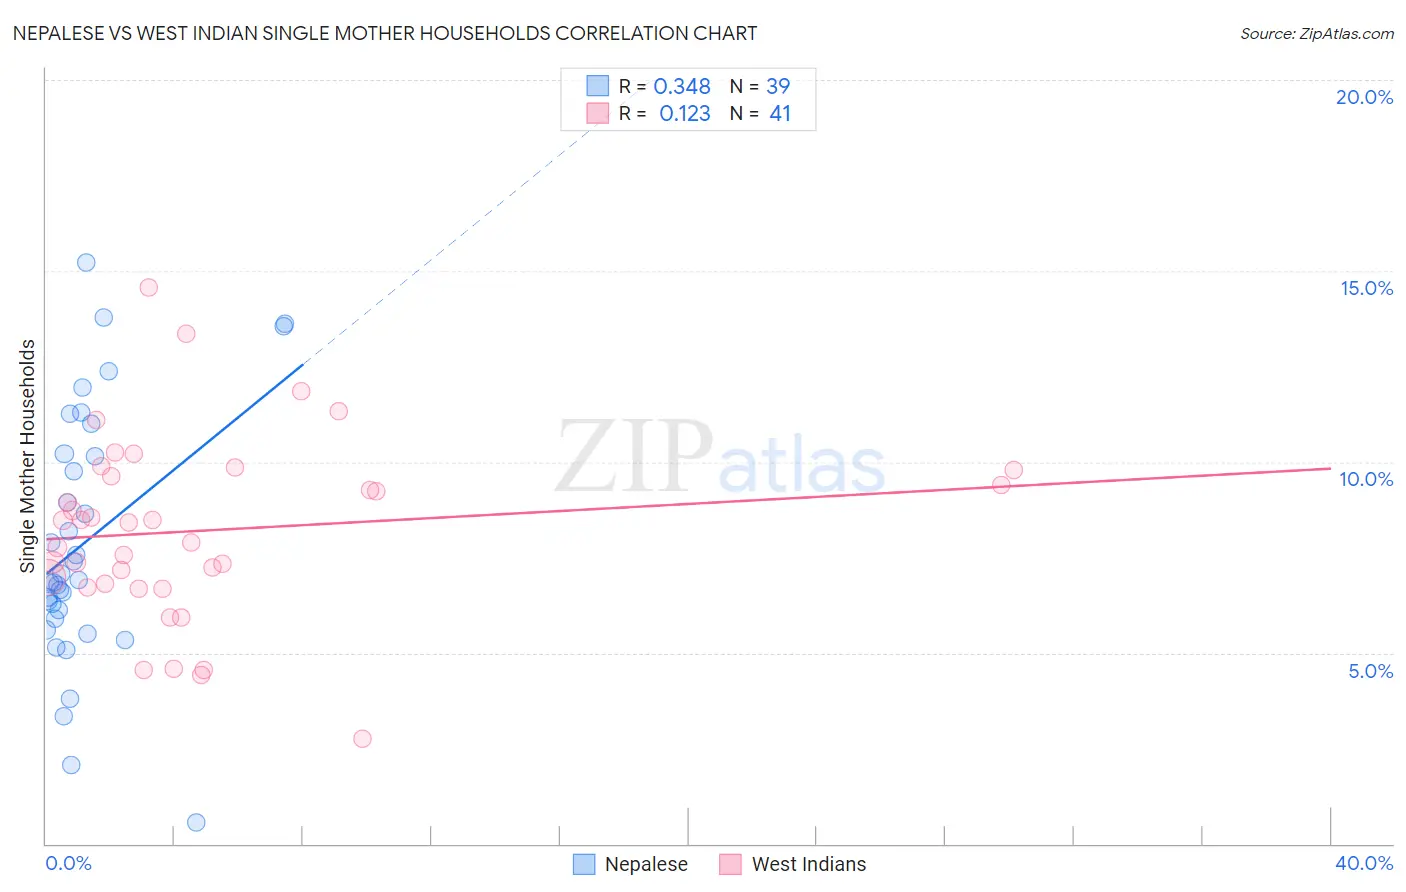
Nepalese vs West Indian Single Mother Households Correlation Chart
The statistical analysis conducted on geographies consisting of 24,517,800 people shows a mild positive correlation between the proportion of Nepalese and percentage of single mother households in the United States with a correlation coefficient (R) of 0.348 and weighted average of 7.5%. Similarly, the statistical analysis conducted on geographies consisting of 253,636,712 people shows a poor positive correlation between the proportion of West Indians and percentage of single mother households in the United States with a correlation coefficient (R) of 0.123 and weighted average of 7.8%, a difference of 5.2%.
Single Mother Households Correlation Summary
| Measurement | Nepalese | West Indian |
| Minimum | 0.56% | 2.7% |
| Maximum | 15.2% | 14.6% |
| Range | 14.7% | 11.8% |
| Mean | 7.9% | 8.2% |
| Median | 6.9% | 8.4% |
| Interquartile 25% (IQ1) | 5.9% | 6.8% |
| Interquartile 75% (IQ3) | 10.2% | 9.7% |
| Interquartile Range (IQR) | 4.3% | 2.9% |
| Standard Deviation (Sample) | 3.3% | 2.4% |
| Standard Deviation (Population) | 3.3% | 2.4% |
Similar Demographics by Single Mother Households
Demographics Similar to Nepalese by Single Mother Households
In terms of single mother households, the demographic groups most similar to Nepalese are Crow (7.4%, a difference of 0.090%), Yaqui (7.4%, a difference of 0.27%), Blackfeet (7.5%, a difference of 0.34%), Immigrants from Nicaragua (7.4%, a difference of 0.35%), and Indonesian (7.5%, a difference of 0.38%).
| Demographics | Rating | Rank | Single Mother Households |
| Immigrants | Yemen | 0.2 /100 | #259 | Tragic 7.4% |
| Immigrants | Zaire | 0.2 /100 | #260 | Tragic 7.4% |
| Japanese | 0.2 /100 | #261 | Tragic 7.4% |
| Immigrants | Somalia | 0.2 /100 | #262 | Tragic 7.4% |
| Immigrants | Nicaragua | 0.2 /100 | #263 | Tragic 7.4% |
| Yaqui | 0.1 /100 | #264 | Tragic 7.4% |
| Crow | 0.1 /100 | #265 | Tragic 7.4% |
| Nepalese | 0.1 /100 | #266 | Tragic 7.5% |
| Blackfeet | 0.1 /100 | #267 | Tragic 7.5% |
| Indonesians | 0.1 /100 | #268 | Tragic 7.5% |
| Somalis | 0.1 /100 | #269 | Tragic 7.5% |
| Immigrants | Cuba | 0.1 /100 | #270 | Tragic 7.5% |
| Salvadorans | 0.1 /100 | #271 | Tragic 7.5% |
| Immigrants | Azores | 0.1 /100 | #272 | Tragic 7.5% |
| Belizeans | 0.1 /100 | #273 | Tragic 7.6% |
Demographics Similar to West Indians by Single Mother Households
In terms of single mother households, the demographic groups most similar to West Indians are Ghanaian (7.8%, a difference of 0.010%), Immigrants from Nigeria (7.8%, a difference of 0.080%), Immigrants from Cameroon (7.9%, a difference of 0.37%), Apache (7.9%, a difference of 0.47%), and Subsaharan African (7.8%, a difference of 0.50%).
| Demographics | Rating | Rank | Single Mother Households |
| Immigrants | Belize | 0.0 /100 | #284 | Tragic 7.7% |
| Trinidadians and Tobagonians | 0.0 /100 | #285 | Tragic 7.7% |
| Immigrants | Middle Africa | 0.0 /100 | #286 | Tragic 7.7% |
| Immigrants | Guatemala | 0.0 /100 | #287 | Tragic 7.7% |
| Sierra Leoneans | 0.0 /100 | #288 | Tragic 7.7% |
| Sub-Saharan Africans | 0.0 /100 | #289 | Tragic 7.8% |
| Immigrants | Nigeria | 0.0 /100 | #290 | Tragic 7.8% |
| West Indians | 0.0 /100 | #291 | Tragic 7.8% |
| Ghanaians | 0.0 /100 | #292 | Tragic 7.8% |
| Immigrants | Cameroon | 0.0 /100 | #293 | Tragic 7.9% |
| Apache | 0.0 /100 | #294 | Tragic 7.9% |
| Barbadians | 0.0 /100 | #295 | Tragic 7.9% |
| Immigrants | Latin America | 0.0 /100 | #296 | Tragic 7.9% |
| Hispanics or Latinos | 0.0 /100 | #297 | Tragic 7.9% |
| Immigrants | West Indies | 0.0 /100 | #298 | Tragic 7.9% |