Nepalese vs Nonimmigrants Single Mother Households
COMPARE
Nepalese
Nonimmigrants
Single Mother Households
Single Mother Households Comparison
Nepalese
Nonimmigrants
7.5%
SINGLE MOTHER HOUSEHOLDS
0.1/ 100
METRIC RATING
266th/ 347
METRIC RANK
6.7%
SINGLE MOTHER HOUSEHOLDS
10.4/ 100
METRIC RATING
210th/ 347
METRIC RANK
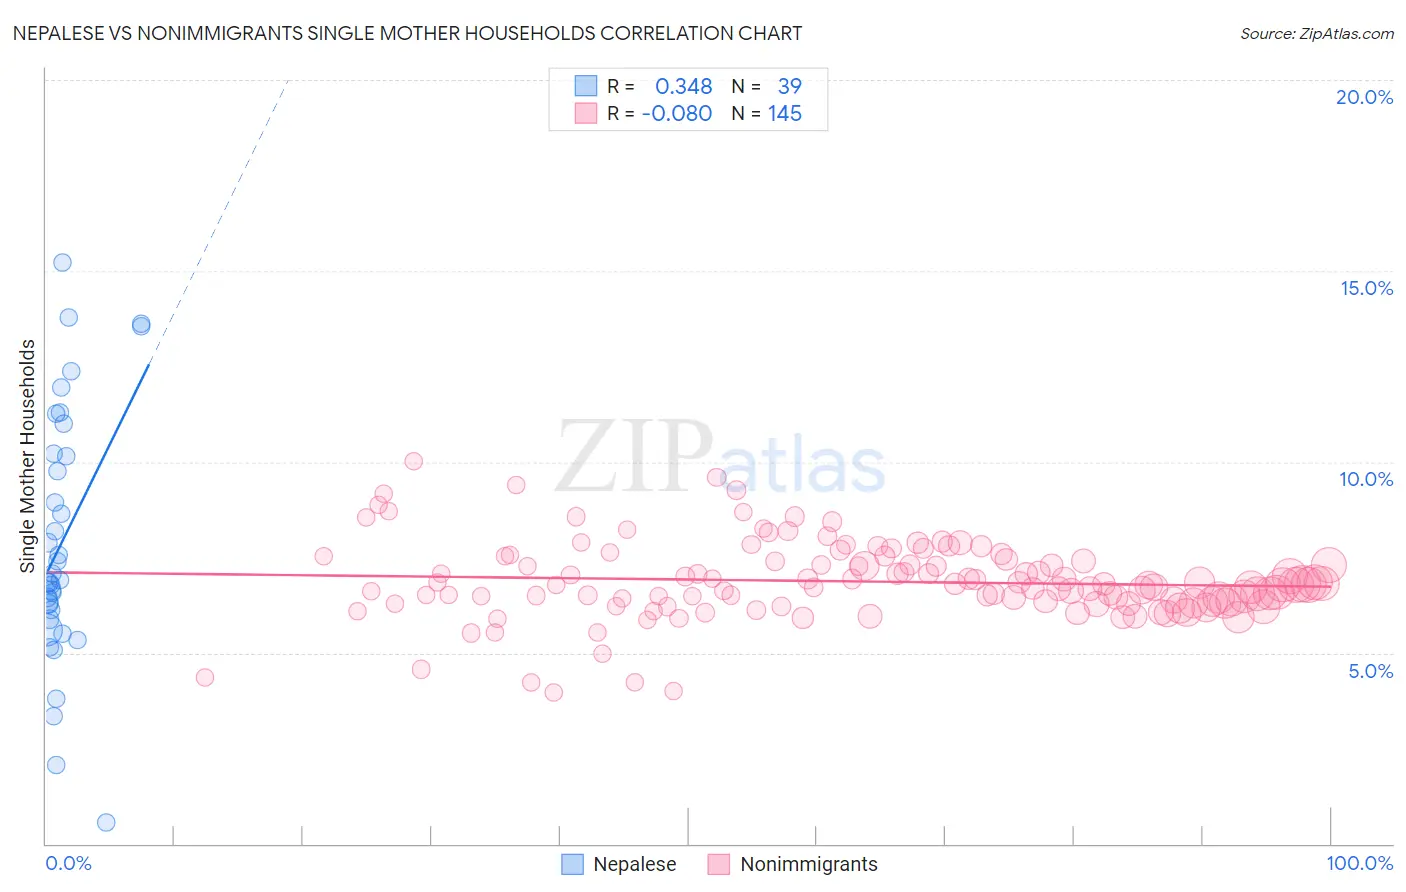
Nepalese vs Nonimmigrants Single Mother Households Correlation Chart
The statistical analysis conducted on geographies consisting of 24,517,800 people shows a mild positive correlation between the proportion of Nepalese and percentage of single mother households in the United States with a correlation coefficient (R) of 0.348 and weighted average of 7.5%. Similarly, the statistical analysis conducted on geographies consisting of 577,079,172 people shows a slight negative correlation between the proportion of Nonimmigrants and percentage of single mother households in the United States with a correlation coefficient (R) of -0.080 and weighted average of 6.7%, a difference of 11.6%.
Single Mother Households Correlation Summary
| Measurement | Nepalese | Nonimmigrants |
| Minimum | 0.56% | 4.0% |
| Maximum | 15.2% | 10.0% |
| Range | 14.7% | 6.1% |
| Mean | 7.9% | 6.9% |
| Median | 6.9% | 6.8% |
| Interquartile 25% (IQ1) | 5.9% | 6.3% |
| Interquartile 75% (IQ3) | 10.2% | 7.4% |
| Interquartile Range (IQR) | 4.3% | 1.1% |
| Standard Deviation (Sample) | 3.3% | 1.0% |
| Standard Deviation (Population) | 3.3% | 1.0% |
Similar Demographics by Single Mother Households
Demographics Similar to Nepalese by Single Mother Households
In terms of single mother households, the demographic groups most similar to Nepalese are Crow (7.4%, a difference of 0.090%), Yaqui (7.4%, a difference of 0.27%), Blackfeet (7.5%, a difference of 0.34%), Immigrants from Nicaragua (7.4%, a difference of 0.35%), and Indonesian (7.5%, a difference of 0.38%).
| Demographics | Rating | Rank | Single Mother Households |
| Immigrants | Yemen | 0.2 /100 | #259 | Tragic 7.4% |
| Immigrants | Zaire | 0.2 /100 | #260 | Tragic 7.4% |
| Japanese | 0.2 /100 | #261 | Tragic 7.4% |
| Immigrants | Somalia | 0.2 /100 | #262 | Tragic 7.4% |
| Immigrants | Nicaragua | 0.2 /100 | #263 | Tragic 7.4% |
| Yaqui | 0.1 /100 | #264 | Tragic 7.4% |
| Crow | 0.1 /100 | #265 | Tragic 7.4% |
| Nepalese | 0.1 /100 | #266 | Tragic 7.5% |
| Blackfeet | 0.1 /100 | #267 | Tragic 7.5% |
| Indonesians | 0.1 /100 | #268 | Tragic 7.5% |
| Somalis | 0.1 /100 | #269 | Tragic 7.5% |
| Immigrants | Cuba | 0.1 /100 | #270 | Tragic 7.5% |
| Salvadorans | 0.1 /100 | #271 | Tragic 7.5% |
| Immigrants | Azores | 0.1 /100 | #272 | Tragic 7.5% |
| Belizeans | 0.1 /100 | #273 | Tragic 7.6% |
Demographics Similar to Nonimmigrants by Single Mother Households
In terms of single mother households, the demographic groups most similar to Nonimmigrants are Immigrants from Colombia (6.7%, a difference of 0.020%), Vietnamese (6.7%, a difference of 0.23%), German Russian (6.7%, a difference of 0.29%), Immigrants from South America (6.7%, a difference of 0.29%), and Cree (6.7%, a difference of 0.37%).
| Demographics | Rating | Rank | Single Mother Households |
| Immigrants | Peru | 12.0 /100 | #203 | Poor 6.7% |
| Immigrants | Fiji | 11.9 /100 | #204 | Poor 6.7% |
| Cree | 11.9 /100 | #205 | Poor 6.7% |
| German Russians | 11.5 /100 | #206 | Poor 6.7% |
| Immigrants | South America | 11.5 /100 | #207 | Poor 6.7% |
| Vietnamese | 11.3 /100 | #208 | Poor 6.7% |
| Immigrants | Colombia | 10.5 /100 | #209 | Poor 6.7% |
| Immigrants | Nonimmigrants | 10.4 /100 | #210 | Poor 6.7% |
| Immigrants | Venezuela | 8.5 /100 | #211 | Tragic 6.7% |
| Immigrants | Eritrea | 8.4 /100 | #212 | Tragic 6.7% |
| Immigrants | Costa Rica | 8.2 /100 | #213 | Tragic 6.7% |
| Immigrants | Uruguay | 7.9 /100 | #214 | Tragic 6.7% |
| Shoshone | 5.7 /100 | #215 | Tragic 6.8% |
| Cherokee | 5.1 /100 | #216 | Tragic 6.8% |
| Aleuts | 4.8 /100 | #217 | Tragic 6.8% |