Nepalese vs Immigrants from Denmark Single Mother Households
COMPARE
Nepalese
Immigrants from Denmark
Single Mother Households
Single Mother Households Comparison
Nepalese
Immigrants from Denmark
7.5%
SINGLE MOTHER HOUSEHOLDS
0.1/ 100
METRIC RATING
266th/ 347
METRIC RANK
5.5%
SINGLE MOTHER HOUSEHOLDS
99.1/ 100
METRIC RATING
55th/ 347
METRIC RANK
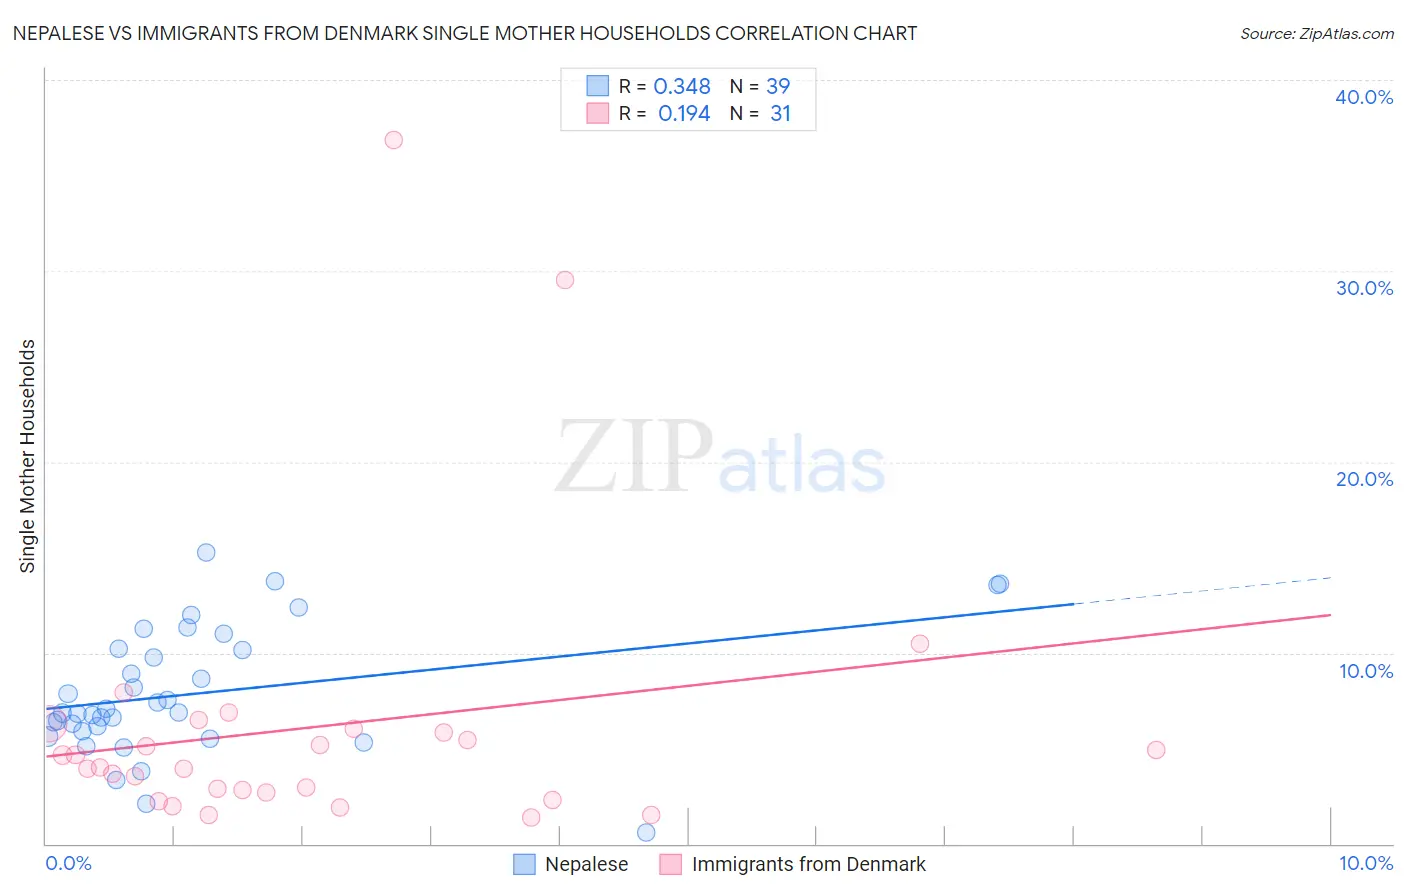
Nepalese vs Immigrants from Denmark Single Mother Households Correlation Chart
The statistical analysis conducted on geographies consisting of 24,517,800 people shows a mild positive correlation between the proportion of Nepalese and percentage of single mother households in the United States with a correlation coefficient (R) of 0.348 and weighted average of 7.5%. Similarly, the statistical analysis conducted on geographies consisting of 136,130,833 people shows a poor positive correlation between the proportion of Immigrants from Denmark and percentage of single mother households in the United States with a correlation coefficient (R) of 0.194 and weighted average of 5.5%, a difference of 35.3%.
Single Mother Households Correlation Summary
| Measurement | Nepalese | Immigrants from Denmark |
| Minimum | 0.56% | 1.4% |
| Maximum | 15.2% | 36.9% |
| Range | 14.7% | 35.5% |
| Mean | 7.9% | 6.1% |
| Median | 6.9% | 4.0% |
| Interquartile 25% (IQ1) | 5.9% | 2.7% |
| Interquartile 75% (IQ3) | 10.2% | 6.0% |
| Interquartile Range (IQR) | 4.3% | 3.3% |
| Standard Deviation (Sample) | 3.3% | 7.6% |
| Standard Deviation (Population) | 3.3% | 7.5% |
Similar Demographics by Single Mother Households
Demographics Similar to Nepalese by Single Mother Households
In terms of single mother households, the demographic groups most similar to Nepalese are Crow (7.4%, a difference of 0.090%), Yaqui (7.4%, a difference of 0.27%), Blackfeet (7.5%, a difference of 0.34%), Immigrants from Nicaragua (7.4%, a difference of 0.35%), and Indonesian (7.5%, a difference of 0.38%).
| Demographics | Rating | Rank | Single Mother Households |
| Immigrants | Yemen | 0.2 /100 | #259 | Tragic 7.4% |
| Immigrants | Zaire | 0.2 /100 | #260 | Tragic 7.4% |
| Japanese | 0.2 /100 | #261 | Tragic 7.4% |
| Immigrants | Somalia | 0.2 /100 | #262 | Tragic 7.4% |
| Immigrants | Nicaragua | 0.2 /100 | #263 | Tragic 7.4% |
| Yaqui | 0.1 /100 | #264 | Tragic 7.4% |
| Crow | 0.1 /100 | #265 | Tragic 7.4% |
| Nepalese | 0.1 /100 | #266 | Tragic 7.5% |
| Blackfeet | 0.1 /100 | #267 | Tragic 7.5% |
| Indonesians | 0.1 /100 | #268 | Tragic 7.5% |
| Somalis | 0.1 /100 | #269 | Tragic 7.5% |
| Immigrants | Cuba | 0.1 /100 | #270 | Tragic 7.5% |
| Salvadorans | 0.1 /100 | #271 | Tragic 7.5% |
| Immigrants | Azores | 0.1 /100 | #272 | Tragic 7.5% |
| Belizeans | 0.1 /100 | #273 | Tragic 7.6% |
Demographics Similar to Immigrants from Denmark by Single Mother Households
In terms of single mother households, the demographic groups most similar to Immigrants from Denmark are Immigrants from Romania (5.5%, a difference of 0.070%), Immigrants from Europe (5.5%, a difference of 0.15%), Immigrants from Lebanon (5.5%, a difference of 0.17%), Immigrants from Russia (5.5%, a difference of 0.19%), and Swedish (5.5%, a difference of 0.29%).
| Demographics | Rating | Rank | Single Mother Households |
| Turks | 99.2 /100 | #48 | Exceptional 5.5% |
| Immigrants | Latvia | 99.2 /100 | #49 | Exceptional 5.5% |
| Immigrants | Scotland | 99.2 /100 | #50 | Exceptional 5.5% |
| Immigrants | Belarus | 99.2 /100 | #51 | Exceptional 5.5% |
| Swedes | 99.1 /100 | #52 | Exceptional 5.5% |
| Immigrants | Russia | 99.1 /100 | #53 | Exceptional 5.5% |
| Immigrants | Lebanon | 99.1 /100 | #54 | Exceptional 5.5% |
| Immigrants | Denmark | 99.1 /100 | #55 | Exceptional 5.5% |
| Immigrants | Romania | 99.0 /100 | #56 | Exceptional 5.5% |
| Immigrants | Europe | 99.0 /100 | #57 | Exceptional 5.5% |
| Danes | 98.9 /100 | #58 | Exceptional 5.5% |
| Luxembourgers | 98.7 /100 | #59 | Exceptional 5.6% |
| Immigrants | Norway | 98.7 /100 | #60 | Exceptional 5.6% |
| Australians | 98.7 /100 | #61 | Exceptional 5.6% |
| Poles | 98.6 /100 | #62 | Exceptional 5.6% |