Kiowa vs Trinidadian and Tobagonian Single Mother Households
COMPARE
Kiowa
Trinidadian and Tobagonian
Single Mother Households
Single Mother Households Comparison
Kiowa
Trinidadians and Tobagonians
7.1%
SINGLE MOTHER HOUSEHOLDS
0.8/ 100
METRIC RATING
239th/ 347
METRIC RANK
7.7%
SINGLE MOTHER HOUSEHOLDS
0.0/ 100
METRIC RATING
285th/ 347
METRIC RANK
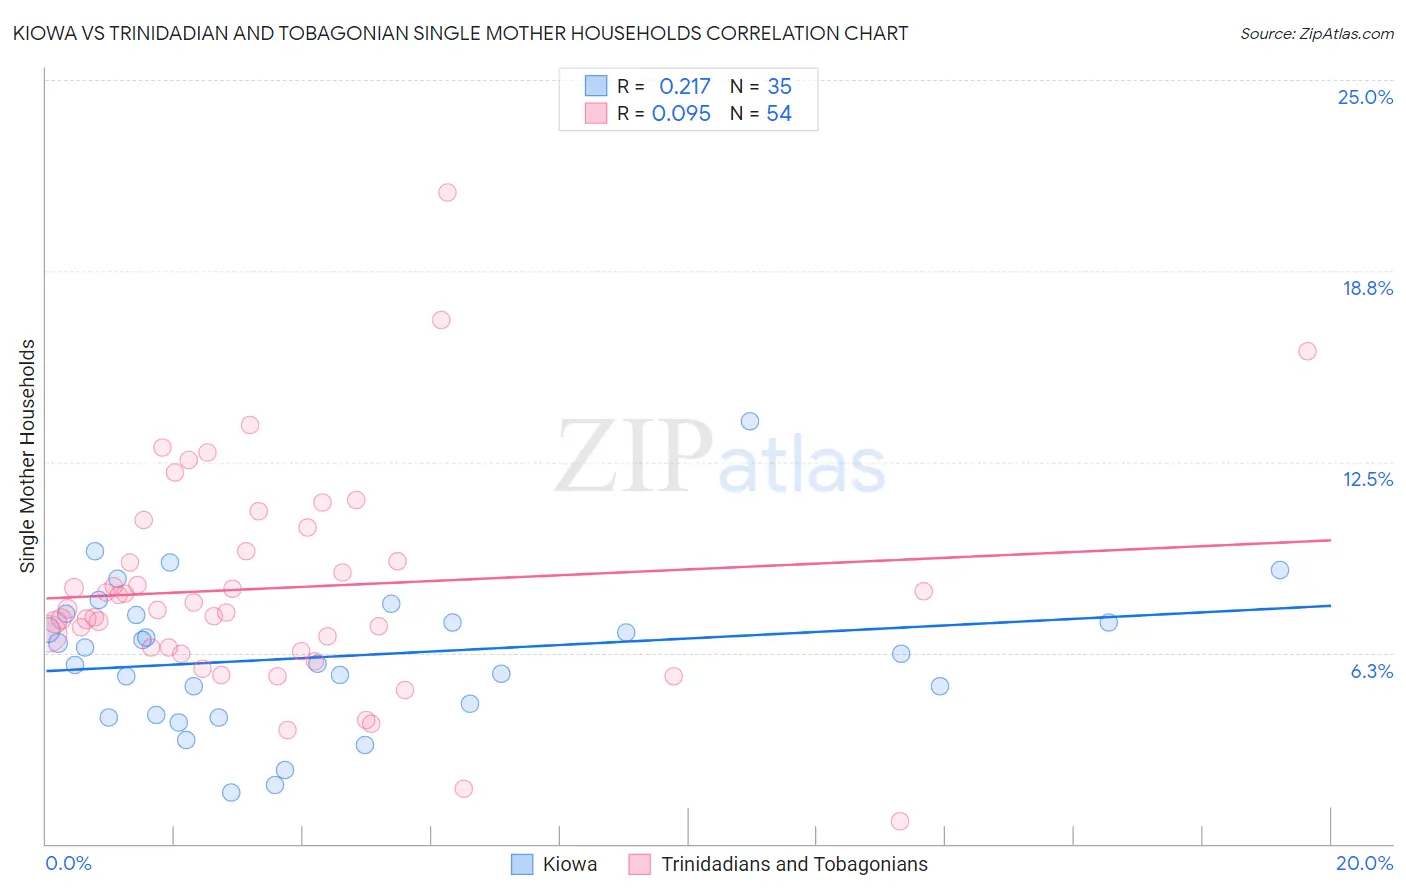
Kiowa vs Trinidadian and Tobagonian Single Mother Households Correlation Chart
The statistical analysis conducted on geographies consisting of 56,080,330 people shows a weak positive correlation between the proportion of Kiowa and percentage of single mother households in the United States with a correlation coefficient (R) of 0.217 and weighted average of 7.1%. Similarly, the statistical analysis conducted on geographies consisting of 219,557,612 people shows a slight positive correlation between the proportion of Trinidadians and Tobagonians and percentage of single mother households in the United States with a correlation coefficient (R) of 0.095 and weighted average of 7.7%, a difference of 8.1%.
Single Mother Households Correlation Summary
| Measurement | Kiowa | Trinidadian and Tobagonian |
| Minimum | 1.7% | 0.73% |
| Maximum | 13.8% | 21.3% |
| Range | 12.2% | 20.6% |
| Mean | 6.1% | 8.4% |
| Median | 6.2% | 7.7% |
| Interquartile 25% (IQ1) | 4.2% | 6.4% |
| Interquartile 75% (IQ3) | 7.5% | 9.6% |
| Interquartile Range (IQR) | 3.3% | 3.2% |
| Standard Deviation (Sample) | 2.4% | 3.6% |
| Standard Deviation (Population) | 2.4% | 3.6% |
Similar Demographics by Single Mother Households
Demographics Similar to Kiowa by Single Mother Households
In terms of single mother households, the demographic groups most similar to Kiowa are Panamanian (7.1%, a difference of 0.27%), Immigrants from Panama (7.2%, a difference of 0.32%), Arapaho (7.1%, a difference of 0.41%), Ute (7.1%, a difference of 0.50%), and Immigrants from Portugal (7.2%, a difference of 0.67%).
| Demographics | Rating | Rank | Single Mother Households |
| Comanche | 1.5 /100 | #232 | Tragic 7.0% |
| Choctaw | 1.4 /100 | #233 | Tragic 7.0% |
| Chickasaw | 1.4 /100 | #234 | Tragic 7.0% |
| Immigrants | Burma/Myanmar | 1.4 /100 | #235 | Tragic 7.0% |
| Ute | 1.0 /100 | #236 | Tragic 7.1% |
| Arapaho | 1.0 /100 | #237 | Tragic 7.1% |
| Panamanians | 0.9 /100 | #238 | Tragic 7.1% |
| Kiowa | 0.8 /100 | #239 | Tragic 7.1% |
| Immigrants | Panama | 0.7 /100 | #240 | Tragic 7.2% |
| Immigrants | Portugal | 0.6 /100 | #241 | Tragic 7.2% |
| Fijians | 0.6 /100 | #242 | Tragic 7.2% |
| Ecuadorians | 0.6 /100 | #243 | Tragic 7.2% |
| Cubans | 0.6 /100 | #244 | Tragic 7.2% |
| Immigrants | Cambodia | 0.5 /100 | #245 | Tragic 7.2% |
| Nicaraguans | 0.5 /100 | #246 | Tragic 7.2% |
Demographics Similar to Trinidadians and Tobagonians by Single Mother Households
In terms of single mother households, the demographic groups most similar to Trinidadians and Tobagonians are Immigrants from Belize (7.7%, a difference of 0.030%), Immigrants from Middle Africa (7.7%, a difference of 0.11%), Immigrants from Guatemala (7.7%, a difference of 0.21%), Sierra Leonean (7.7%, a difference of 0.26%), and Nigerian (7.7%, a difference of 0.63%).
| Demographics | Rating | Rank | Single Mother Households |
| Central Americans | 0.1 /100 | #278 | Tragic 7.6% |
| Immigrants | El Salvador | 0.0 /100 | #279 | Tragic 7.6% |
| Immigrants | Sierra Leone | 0.0 /100 | #280 | Tragic 7.7% |
| Immigrants | Laos | 0.0 /100 | #281 | Tragic 7.7% |
| Guatemalans | 0.0 /100 | #282 | Tragic 7.7% |
| Nigerians | 0.0 /100 | #283 | Tragic 7.7% |
| Immigrants | Belize | 0.0 /100 | #284 | Tragic 7.7% |
| Trinidadians and Tobagonians | 0.0 /100 | #285 | Tragic 7.7% |
| Immigrants | Middle Africa | 0.0 /100 | #286 | Tragic 7.7% |
| Immigrants | Guatemala | 0.0 /100 | #287 | Tragic 7.7% |
| Sierra Leoneans | 0.0 /100 | #288 | Tragic 7.7% |
| Sub-Saharan Africans | 0.0 /100 | #289 | Tragic 7.8% |
| Immigrants | Nigeria | 0.0 /100 | #290 | Tragic 7.8% |
| West Indians | 0.0 /100 | #291 | Tragic 7.8% |
| Ghanaians | 0.0 /100 | #292 | Tragic 7.8% |