Nepalese vs Scandinavian Child Poverty Among Boys Under 16
COMPARE
Nepalese
Scandinavian
Child Poverty Among Boys Under 16
Child Poverty Among Boys Under 16 Comparison
Nepalese
Scandinavians
18.0%
CHILD POVERTY AMONG BOYS UNDER 16
3.2/ 100
METRIC RATING
224th/ 347
METRIC RANK
14.4%
CHILD POVERTY AMONG BOYS UNDER 16
98.8/ 100
METRIC RATING
61st/ 347
METRIC RANK
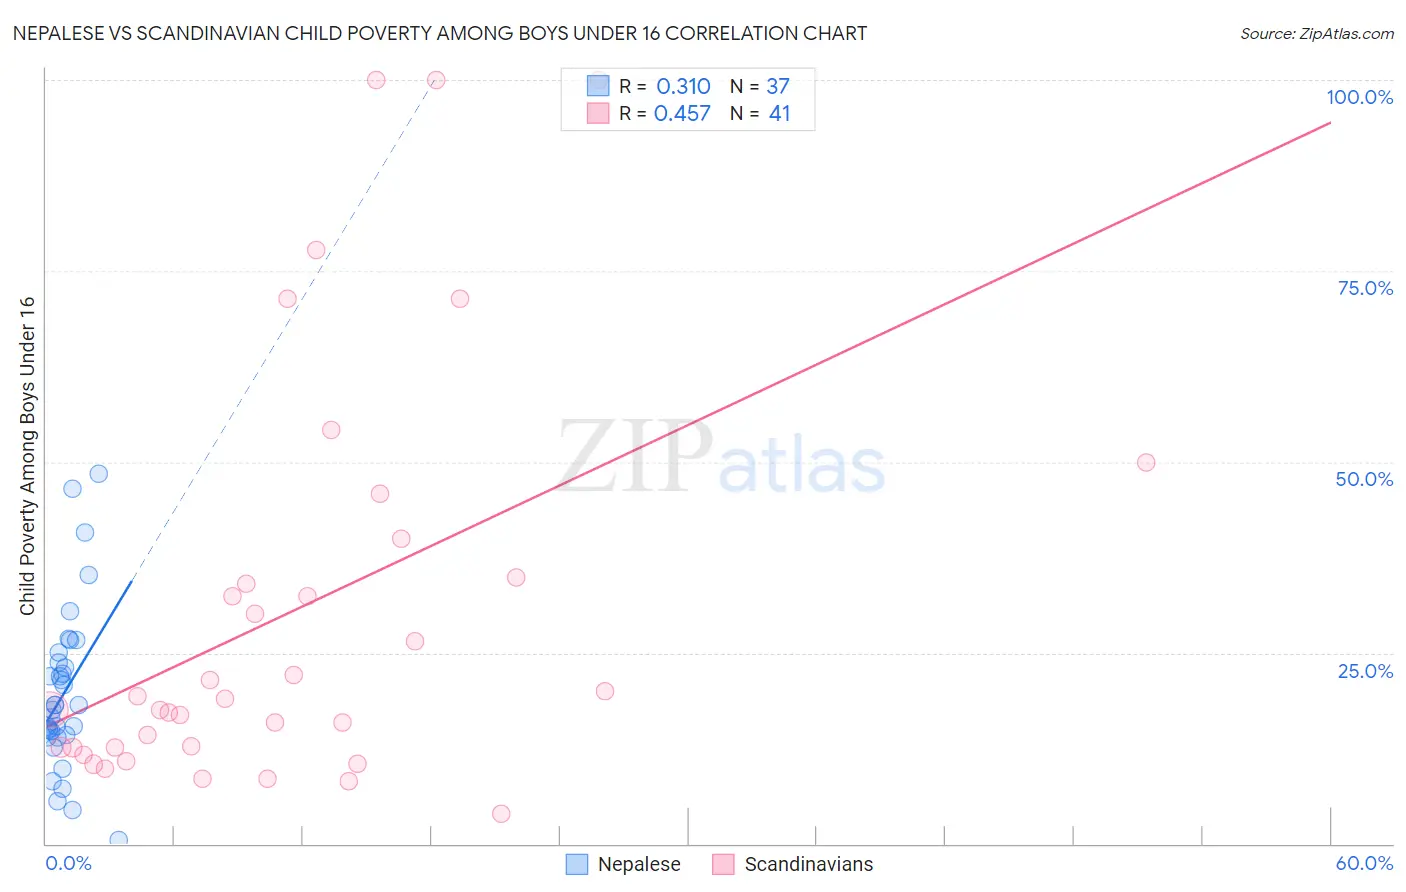
Nepalese vs Scandinavian Child Poverty Among Boys Under 16 Correlation Chart
The statistical analysis conducted on geographies consisting of 24,516,782 people shows a mild positive correlation between the proportion of Nepalese and poverty level among boys under the age of 16 in the United States with a correlation coefficient (R) of 0.310 and weighted average of 18.0%. Similarly, the statistical analysis conducted on geographies consisting of 460,968,733 people shows a moderate positive correlation between the proportion of Scandinavians and poverty level among boys under the age of 16 in the United States with a correlation coefficient (R) of 0.457 and weighted average of 14.4%, a difference of 25.1%.
Child Poverty Among Boys Under 16 Correlation Summary
| Measurement | Nepalese | Scandinavian |
| Minimum | 0.48% | 4.0% |
| Maximum | 48.5% | 100.0% |
| Range | 48.0% | 96.0% |
| Mean | 19.8% | 30.5% |
| Median | 18.2% | 19.0% |
| Interquartile 25% (IQ1) | 14.1% | 12.6% |
| Interquartile 75% (IQ3) | 24.4% | 37.4% |
| Interquartile Range (IQR) | 10.3% | 24.8% |
| Standard Deviation (Sample) | 10.6% | 26.8% |
| Standard Deviation (Population) | 10.5% | 26.5% |
Similar Demographics by Child Poverty Among Boys Under 16
Demographics Similar to Nepalese by Child Poverty Among Boys Under 16
In terms of child poverty among boys under 16, the demographic groups most similar to Nepalese are Inupiat (18.1%, a difference of 0.41%), Cuban (17.9%, a difference of 0.47%), Pennsylvania German (17.9%, a difference of 0.56%), Immigrants from Africa (18.1%, a difference of 0.57%), and Bermudan (18.1%, a difference of 0.67%).
| Demographics | Rating | Rank | Child Poverty Among Boys Under 16 |
| Japanese | 5.5 /100 | #217 | Tragic 17.7% |
| Iraqis | 5.5 /100 | #218 | Tragic 17.7% |
| Sierra Leoneans | 5.3 /100 | #219 | Tragic 17.8% |
| Immigrants | Cambodia | 5.1 /100 | #220 | Tragic 17.8% |
| Immigrants | Panama | 4.3 /100 | #221 | Tragic 17.9% |
| Pennsylvania Germans | 3.9 /100 | #222 | Tragic 17.9% |
| Cubans | 3.8 /100 | #223 | Tragic 17.9% |
| Nepalese | 3.2 /100 | #224 | Tragic 18.0% |
| Inupiat | 2.7 /100 | #225 | Tragic 18.1% |
| Immigrants | Africa | 2.6 /100 | #226 | Tragic 18.1% |
| Bermudans | 2.5 /100 | #227 | Tragic 18.1% |
| Immigrants | Nonimmigrants | 2.2 /100 | #228 | Tragic 18.2% |
| Immigrants | Micronesia | 1.8 /100 | #229 | Tragic 18.3% |
| Fijians | 1.8 /100 | #230 | Tragic 18.3% |
| Nicaraguans | 1.4 /100 | #231 | Tragic 18.4% |
Demographics Similar to Scandinavians by Child Poverty Among Boys Under 16
In terms of child poverty among boys under 16, the demographic groups most similar to Scandinavians are Immigrants from Belgium (14.4%, a difference of 0.12%), Immigrants from Czechoslovakia (14.4%, a difference of 0.14%), Immigrants from Sweden (14.4%, a difference of 0.16%), Polish (14.4%, a difference of 0.24%), and Immigrants from Israel (14.4%, a difference of 0.32%).
| Demographics | Rating | Rank | Child Poverty Among Boys Under 16 |
| Immigrants | Serbia | 99.0 /100 | #54 | Exceptional 14.3% |
| Immigrants | Pakistan | 99.0 /100 | #55 | Exceptional 14.3% |
| Zimbabweans | 99.0 /100 | #56 | Exceptional 14.3% |
| Poles | 98.9 /100 | #57 | Exceptional 14.4% |
| Immigrants | Sweden | 98.9 /100 | #58 | Exceptional 14.4% |
| Immigrants | Czechoslovakia | 98.9 /100 | #59 | Exceptional 14.4% |
| Immigrants | Belgium | 98.9 /100 | #60 | Exceptional 14.4% |
| Scandinavians | 98.8 /100 | #61 | Exceptional 14.4% |
| Immigrants | Israel | 98.7 /100 | #62 | Exceptional 14.4% |
| Cambodians | 98.5 /100 | #63 | Exceptional 14.5% |
| Immigrants | Romania | 98.5 /100 | #64 | Exceptional 14.5% |
| Soviet Union | 98.5 /100 | #65 | Exceptional 14.5% |
| Immigrants | Bulgaria | 98.5 /100 | #66 | Exceptional 14.5% |
| Immigrants | Europe | 98.4 /100 | #67 | Exceptional 14.5% |
| Slovenes | 98.4 /100 | #68 | Exceptional 14.5% |