Immigrants from Belgium vs Scandinavian Average Family Size
COMPARE
Immigrants from Belgium
Scandinavian
Average Family Size
Average Family Size Comparison
Immigrants from Belgium
Scandinavians
3.15
AVERAGE FAMILY SIZE
0.6/ 100
METRIC RATING
274th/ 347
METRIC RANK
3.14
AVERAGE FAMILY SIZE
0.2/ 100
METRIC RATING
293rd/ 347
METRIC RANK
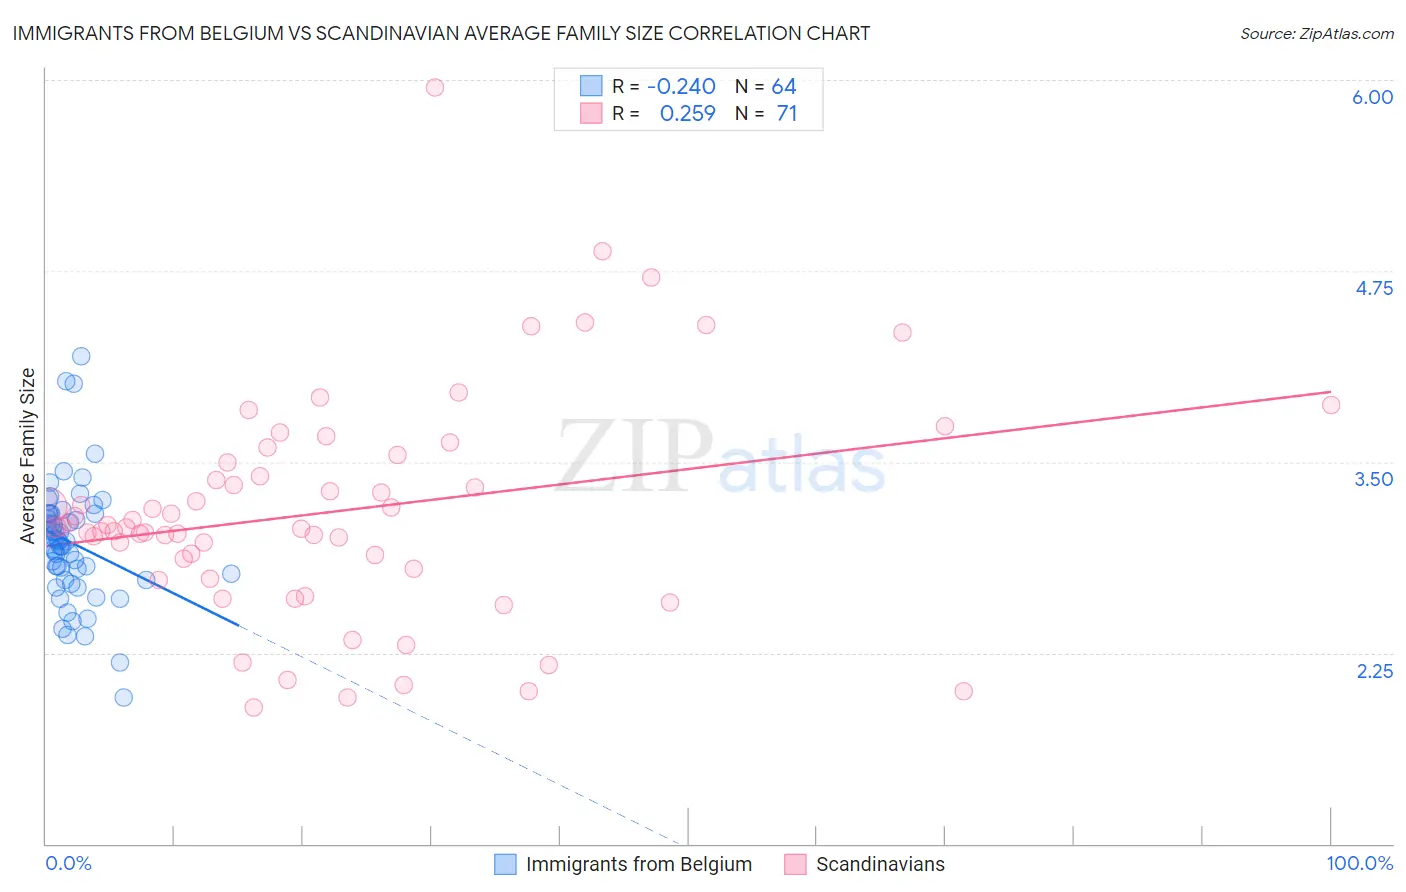
Immigrants from Belgium vs Scandinavian Average Family Size Correlation Chart
The statistical analysis conducted on geographies consisting of 146,697,928 people shows a weak negative correlation between the proportion of Immigrants from Belgium and average family size in the United States with a correlation coefficient (R) of -0.240 and weighted average of 3.15. Similarly, the statistical analysis conducted on geographies consisting of 472,285,775 people shows a weak positive correlation between the proportion of Scandinavians and average family size in the United States with a correlation coefficient (R) of 0.259 and weighted average of 3.14, a difference of 0.46%.
Average Family Size Correlation Summary
| Measurement | Immigrants from Belgium | Scandinavian |
| Minimum | 1.96 | 1.89 |
| Maximum | 4.19 | 5.95 |
| Range | 2.23 | 4.06 |
| Mean | 2.97 | 3.17 |
| Median | 2.98 | 3.07 |
| Interquartile 25% (IQ1) | 2.75 | 2.80 |
| Interquartile 75% (IQ3) | 3.16 | 3.49 |
| Interquartile Range (IQR) | 0.41 | 0.69 |
| Standard Deviation (Sample) | 0.39 | 0.73 |
| Standard Deviation (Population) | 0.39 | 0.72 |
Demographics Similar to Immigrants from Belgium and Scandinavians by Average Family Size
In terms of average family size, the demographic groups most similar to Immigrants from Belgium are New Zealander (3.15, a difference of 0.0%), Cambodian (3.15, a difference of 0.0%), Immigrants from Bosnia and Herzegovina (3.15, a difference of 0.080%), Swiss (3.15, a difference of 0.10%), and Okinawan (3.15, a difference of 0.13%). Similarly, the demographic groups most similar to Scandinavians are European (3.14, a difference of 0.010%), Alsatian (3.14, a difference of 0.030%), Cypriot (3.14, a difference of 0.070%), Greek (3.14, a difference of 0.10%), and Immigrants from Czechoslovakia (3.14, a difference of 0.10%).
| Demographics | Rating | Rank | Average Family Size |
| New Zealanders | 0.6 /100 | #273 | Tragic 3.15 |
| Immigrants | Belgium | 0.6 /100 | #274 | Tragic 3.15 |
| Cambodians | 0.6 /100 | #275 | Tragic 3.15 |
| Immigrants | Bosnia and Herzegovina | 0.5 /100 | #276 | Tragic 3.15 |
| Swiss | 0.5 /100 | #277 | Tragic 3.15 |
| Okinawans | 0.5 /100 | #278 | Tragic 3.15 |
| Immigrants | Europe | 0.5 /100 | #279 | Tragic 3.15 |
| Immigrants | England | 0.4 /100 | #280 | Tragic 3.15 |
| Immigrants | Denmark | 0.4 /100 | #281 | Tragic 3.15 |
| Yugoslavians | 0.4 /100 | #282 | Tragic 3.15 |
| German Russians | 0.4 /100 | #283 | Tragic 3.15 |
| Immigrants | France | 0.4 /100 | #284 | Tragic 3.15 |
| Whites/Caucasians | 0.3 /100 | #285 | Tragic 3.14 |
| Immigrants | Netherlands | 0.3 /100 | #286 | Tragic 3.14 |
| Greeks | 0.3 /100 | #287 | Tragic 3.14 |
| Immigrants | Czechoslovakia | 0.3 /100 | #288 | Tragic 3.14 |
| Immigrants | Norway | 0.3 /100 | #289 | Tragic 3.14 |
| Cypriots | 0.3 /100 | #290 | Tragic 3.14 |
| Alsatians | 0.2 /100 | #291 | Tragic 3.14 |
| Europeans | 0.2 /100 | #292 | Tragic 3.14 |
| Scandinavians | 0.2 /100 | #293 | Tragic 3.14 |