Zimbabwean vs Scandinavian Average Family Size
COMPARE
Zimbabwean
Scandinavian
Average Family Size
Average Family Size Comparison
Zimbabweans
Scandinavians
3.20
AVERAGE FAMILY SIZE
12.6/ 100
METRIC RATING
210th/ 347
METRIC RANK
3.14
AVERAGE FAMILY SIZE
0.2/ 100
METRIC RATING
293rd/ 347
METRIC RANK
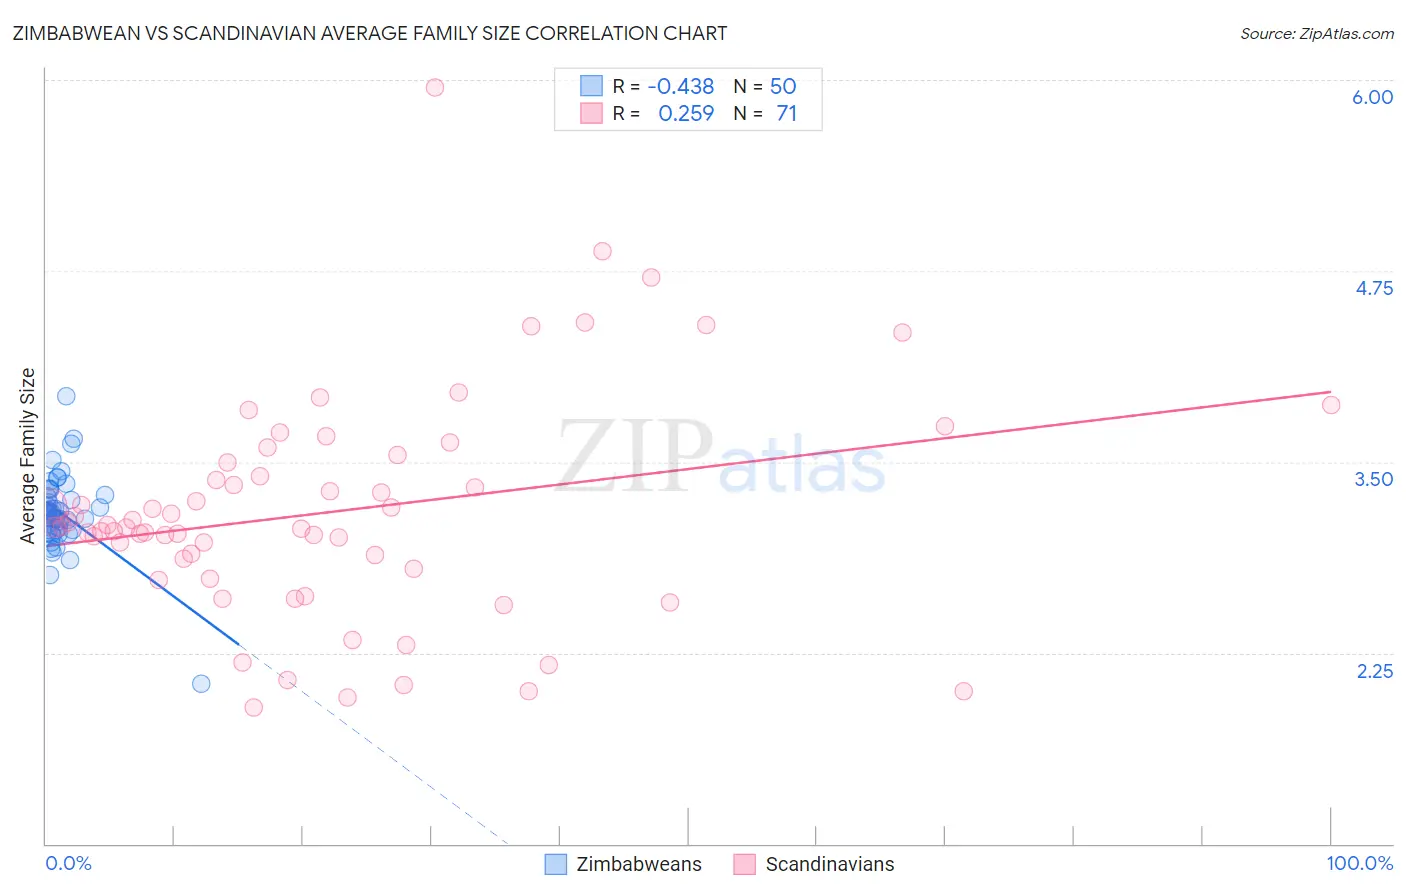
Zimbabwean vs Scandinavian Average Family Size Correlation Chart
The statistical analysis conducted on geographies consisting of 69,189,771 people shows a moderate negative correlation between the proportion of Zimbabweans and average family size in the United States with a correlation coefficient (R) of -0.438 and weighted average of 3.20. Similarly, the statistical analysis conducted on geographies consisting of 472,285,775 people shows a weak positive correlation between the proportion of Scandinavians and average family size in the United States with a correlation coefficient (R) of 0.259 and weighted average of 3.14, a difference of 1.9%.
Average Family Size Correlation Summary
| Measurement | Zimbabwean | Scandinavian |
| Minimum | 2.05 | 1.89 |
| Maximum | 3.93 | 5.95 |
| Range | 1.88 | 4.06 |
| Mean | 3.16 | 3.17 |
| Median | 3.15 | 3.07 |
| Interquartile 25% (IQ1) | 3.05 | 2.80 |
| Interquartile 75% (IQ3) | 3.28 | 3.49 |
| Interquartile Range (IQR) | 0.23 | 0.69 |
| Standard Deviation (Sample) | 0.26 | 0.73 |
| Standard Deviation (Population) | 0.26 | 0.72 |
Similar Demographics by Average Family Size
Demographics Similar to Zimbabweans by Average Family Size
In terms of average family size, the demographic groups most similar to Zimbabweans are Immigrants from Iran (3.20, a difference of 0.020%), Creek (3.20, a difference of 0.020%), Chippewa (3.20, a difference of 0.030%), Sudanese (3.20, a difference of 0.030%), and Filipino (3.20, a difference of 0.040%).
| Demographics | Rating | Rank | Average Family Size |
| Immigrants | Nepal | 18.1 /100 | #203 | Poor 3.21 |
| Immigrants | Poland | 16.6 /100 | #204 | Poor 3.20 |
| Paraguayans | 16.3 /100 | #205 | Poor 3.20 |
| Immigrants | Cabo Verde | 16.0 /100 | #206 | Poor 3.20 |
| Filipinos | 13.6 /100 | #207 | Poor 3.20 |
| Chippewa | 13.3 /100 | #208 | Poor 3.20 |
| Sudanese | 13.3 /100 | #209 | Poor 3.20 |
| Zimbabweans | 12.6 /100 | #210 | Poor 3.20 |
| Immigrants | Iran | 12.1 /100 | #211 | Poor 3.20 |
| Creek | 12.1 /100 | #212 | Poor 3.20 |
| Mongolians | 11.5 /100 | #213 | Poor 3.20 |
| Somalis | 11.2 /100 | #214 | Poor 3.20 |
| Delaware | 11.1 /100 | #215 | Poor 3.20 |
| Bermudans | 11.0 /100 | #216 | Poor 3.20 |
| Immigrants | Somalia | 10.3 /100 | #217 | Poor 3.20 |
Demographics Similar to Scandinavians by Average Family Size
In terms of average family size, the demographic groups most similar to Scandinavians are European (3.14, a difference of 0.010%), Immigrants from Croatia (3.14, a difference of 0.020%), Alsatian (3.14, a difference of 0.030%), Austrian (3.14, a difference of 0.030%), and Ukrainian (3.14, a difference of 0.030%).
| Demographics | Rating | Rank | Average Family Size |
| Immigrants | Netherlands | 0.3 /100 | #286 | Tragic 3.14 |
| Greeks | 0.3 /100 | #287 | Tragic 3.14 |
| Immigrants | Czechoslovakia | 0.3 /100 | #288 | Tragic 3.14 |
| Immigrants | Norway | 0.3 /100 | #289 | Tragic 3.14 |
| Cypriots | 0.3 /100 | #290 | Tragic 3.14 |
| Alsatians | 0.2 /100 | #291 | Tragic 3.14 |
| Europeans | 0.2 /100 | #292 | Tragic 3.14 |
| Scandinavians | 0.2 /100 | #293 | Tragic 3.14 |
| Immigrants | Croatia | 0.2 /100 | #294 | Tragic 3.14 |
| Austrians | 0.2 /100 | #295 | Tragic 3.14 |
| Ukrainians | 0.2 /100 | #296 | Tragic 3.14 |
| Immigrants | Western Europe | 0.2 /100 | #297 | Tragic 3.14 |
| Colville | 0.2 /100 | #298 | Tragic 3.14 |
| Canadians | 0.2 /100 | #299 | Tragic 3.14 |
| Immigrants | Sweden | 0.2 /100 | #300 | Tragic 3.14 |