Navajo vs Immigrants from Spain Married-couple Households
COMPARE
Navajo
Immigrants from Spain
Married-couple Households
Married-couple Households Comparison
Navajo
Immigrants from Spain
40.1%
MARRIED-COUPLE HOUSEHOLDS
0.0/ 100
METRIC RATING
324th/ 347
METRIC RANK
45.3%
MARRIED-COUPLE HOUSEHOLDS
7.3/ 100
METRIC RATING
211th/ 347
METRIC RANK
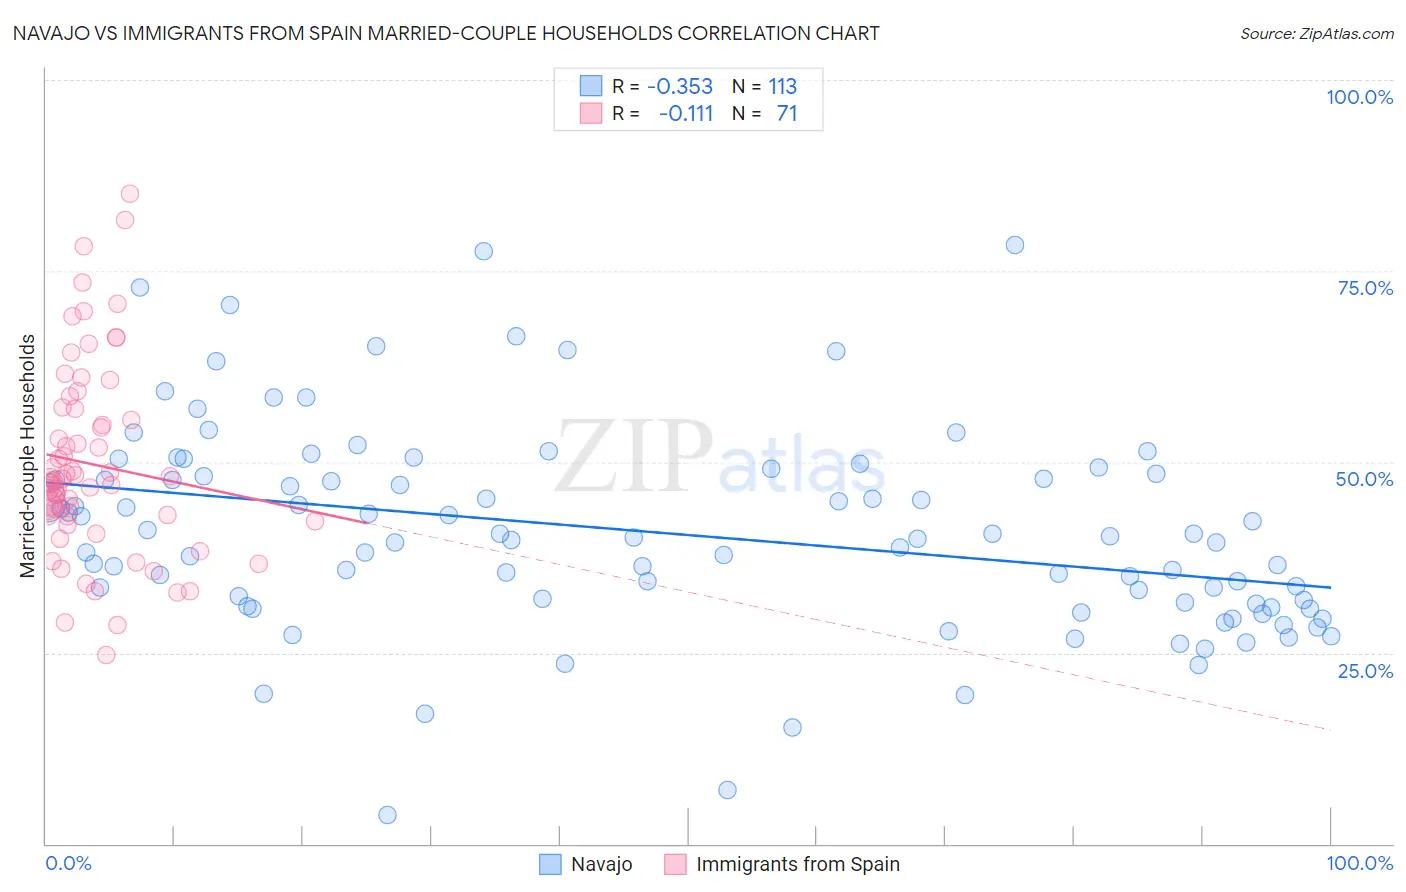
Navajo vs Immigrants from Spain Married-couple Households Correlation Chart
The statistical analysis conducted on geographies consisting of 224,747,945 people shows a mild negative correlation between the proportion of Navajo and percentage of married-couple family households in the United States with a correlation coefficient (R) of -0.353 and weighted average of 40.1%. Similarly, the statistical analysis conducted on geographies consisting of 239,598,425 people shows a poor negative correlation between the proportion of Immigrants from Spain and percentage of married-couple family households in the United States with a correlation coefficient (R) of -0.111 and weighted average of 45.3%, a difference of 13.2%.
Married-couple Households Correlation Summary
| Measurement | Navajo | Immigrants from Spain |
| Minimum | 3.8% | 24.7% |
| Maximum | 78.4% | 85.1% |
| Range | 74.6% | 60.3% |
| Mean | 40.7% | 49.7% |
| Median | 39.9% | 47.4% |
| Interquartile 25% (IQ1) | 31.5% | 42.8% |
| Interquartile 75% (IQ3) | 48.3% | 57.0% |
| Interquartile Range (IQR) | 16.8% | 14.2% |
| Standard Deviation (Sample) | 13.4% | 12.5% |
| Standard Deviation (Population) | 13.3% | 12.4% |
Similar Demographics by Married-couple Households
Demographics Similar to Navajo by Married-couple Households
In terms of married-couple households, the demographic groups most similar to Navajo are Immigrants from Zaire (40.1%, a difference of 0.010%), Puerto Rican (40.1%, a difference of 0.010%), Pueblo (40.0%, a difference of 0.23%), Immigrants from Liberia (40.3%, a difference of 0.67%), and U.S. Virgin Islander (39.8%, a difference of 0.69%).
| Demographics | Rating | Rank | Married-couple Households |
| Immigrants | Jamaica | 0.0 /100 | #317 | Tragic 40.7% |
| Liberians | 0.0 /100 | #318 | Tragic 40.7% |
| Bahamians | 0.0 /100 | #319 | Tragic 40.5% |
| West Indians | 0.0 /100 | #320 | Tragic 40.3% |
| Immigrants | Liberia | 0.0 /100 | #321 | Tragic 40.3% |
| Immigrants | Zaire | 0.0 /100 | #322 | Tragic 40.1% |
| Puerto Ricans | 0.0 /100 | #323 | Tragic 40.1% |
| Navajo | 0.0 /100 | #324 | Tragic 40.1% |
| Pueblo | 0.0 /100 | #325 | Tragic 40.0% |
| U.S. Virgin Islanders | 0.0 /100 | #326 | Tragic 39.8% |
| Lumbee | 0.0 /100 | #327 | Tragic 39.6% |
| Barbadians | 0.0 /100 | #328 | Tragic 39.4% |
| Immigrants | Dominica | 0.0 /100 | #329 | Tragic 39.4% |
| Immigrants | Barbados | 0.0 /100 | #330 | Tragic 39.2% |
| Immigrants | Congo | 0.0 /100 | #331 | Tragic 39.0% |
Demographics Similar to Immigrants from Spain by Married-couple Households
In terms of married-couple households, the demographic groups most similar to Immigrants from Spain are Cuban (45.4%, a difference of 0.050%), Creek (45.3%, a difference of 0.13%), Immigrants from Uzbekistan (45.4%, a difference of 0.14%), Immigrants from France (45.4%, a difference of 0.19%), and Hispanic or Latino (45.4%, a difference of 0.19%).
| Demographics | Rating | Rank | Married-couple Households |
| Aleuts | 12.5 /100 | #204 | Poor 45.6% |
| Nepalese | 11.9 /100 | #205 | Poor 45.6% |
| Uruguayans | 10.4 /100 | #206 | Poor 45.5% |
| Immigrants | France | 8.8 /100 | #207 | Tragic 45.4% |
| Hispanics or Latinos | 8.7 /100 | #208 | Tragic 45.4% |
| Immigrants | Uzbekistan | 8.4 /100 | #209 | Tragic 45.4% |
| Cubans | 7.7 /100 | #210 | Tragic 45.4% |
| Immigrants | Spain | 7.3 /100 | #211 | Tragic 45.3% |
| Creek | 6.4 /100 | #212 | Tragic 45.3% |
| Yakama | 5.8 /100 | #213 | Tragic 45.2% |
| Japanese | 5.7 /100 | #214 | Tragic 45.2% |
| Immigrants | Nepal | 5.6 /100 | #215 | Tragic 45.2% |
| Immigrants | Portugal | 5.6 /100 | #216 | Tragic 45.2% |
| Panamanians | 5.5 /100 | #217 | Tragic 45.2% |
| Immigrants | Azores | 5.3 /100 | #218 | Tragic 45.2% |