Navajo vs Welsh Married-couple Households
COMPARE
Navajo
Welsh
Married-couple Households
Married-couple Households Comparison
Navajo
Welsh
40.1%
MARRIED-COUPLE HOUSEHOLDS
0.0/ 100
METRIC RATING
324th/ 347
METRIC RANK
48.8%
MARRIED-COUPLE HOUSEHOLDS
99.5/ 100
METRIC RATING
44th/ 347
METRIC RANK
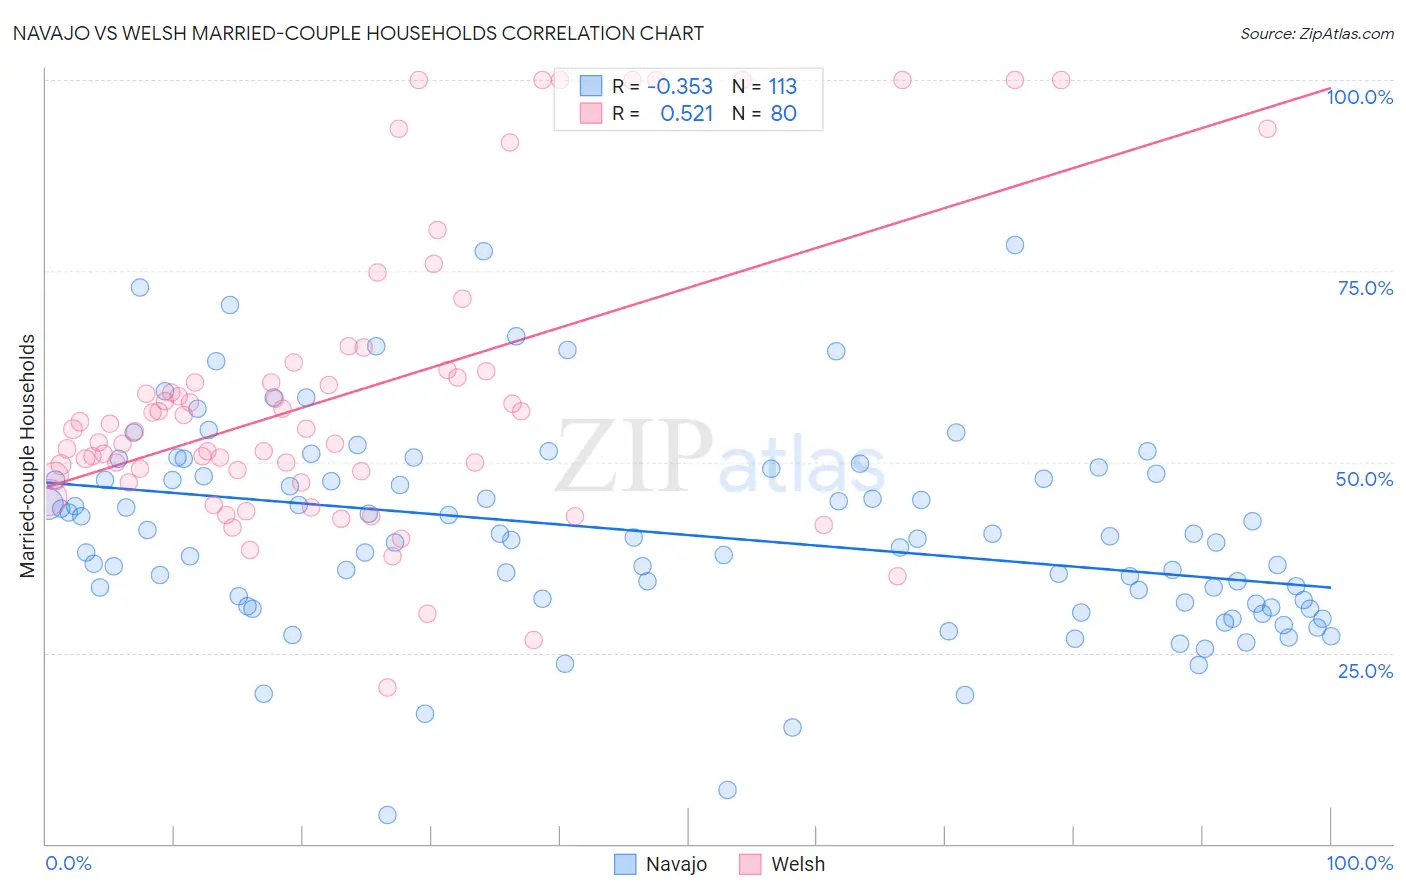
Navajo vs Welsh Married-couple Households Correlation Chart
The statistical analysis conducted on geographies consisting of 224,747,945 people shows a mild negative correlation between the proportion of Navajo and percentage of married-couple family households in the United States with a correlation coefficient (R) of -0.353 and weighted average of 40.1%. Similarly, the statistical analysis conducted on geographies consisting of 528,152,714 people shows a substantial positive correlation between the proportion of Welsh and percentage of married-couple family households in the United States with a correlation coefficient (R) of 0.521 and weighted average of 48.8%, a difference of 21.8%.
Married-couple Households Correlation Summary
| Measurement | Navajo | Welsh |
| Minimum | 3.8% | 20.5% |
| Maximum | 78.4% | 100.0% |
| Range | 74.6% | 79.5% |
| Mean | 40.7% | 59.0% |
| Median | 39.9% | 54.3% |
| Interquartile 25% (IQ1) | 31.5% | 48.5% |
| Interquartile 75% (IQ3) | 48.3% | 62.0% |
| Interquartile Range (IQR) | 16.8% | 13.5% |
| Standard Deviation (Sample) | 13.4% | 19.3% |
| Standard Deviation (Population) | 13.3% | 19.2% |
Similar Demographics by Married-couple Households
Demographics Similar to Navajo by Married-couple Households
In terms of married-couple households, the demographic groups most similar to Navajo are Immigrants from Zaire (40.1%, a difference of 0.010%), Puerto Rican (40.1%, a difference of 0.010%), Pueblo (40.0%, a difference of 0.23%), Immigrants from Liberia (40.3%, a difference of 0.67%), and U.S. Virgin Islander (39.8%, a difference of 0.69%).
| Demographics | Rating | Rank | Married-couple Households |
| Immigrants | Jamaica | 0.0 /100 | #317 | Tragic 40.7% |
| Liberians | 0.0 /100 | #318 | Tragic 40.7% |
| Bahamians | 0.0 /100 | #319 | Tragic 40.5% |
| West Indians | 0.0 /100 | #320 | Tragic 40.3% |
| Immigrants | Liberia | 0.0 /100 | #321 | Tragic 40.3% |
| Immigrants | Zaire | 0.0 /100 | #322 | Tragic 40.1% |
| Puerto Ricans | 0.0 /100 | #323 | Tragic 40.1% |
| Navajo | 0.0 /100 | #324 | Tragic 40.1% |
| Pueblo | 0.0 /100 | #325 | Tragic 40.0% |
| U.S. Virgin Islanders | 0.0 /100 | #326 | Tragic 39.8% |
| Lumbee | 0.0 /100 | #327 | Tragic 39.6% |
| Barbadians | 0.0 /100 | #328 | Tragic 39.4% |
| Immigrants | Dominica | 0.0 /100 | #329 | Tragic 39.4% |
| Immigrants | Barbados | 0.0 /100 | #330 | Tragic 39.2% |
| Immigrants | Congo | 0.0 /100 | #331 | Tragic 39.0% |
Demographics Similar to Welsh by Married-couple Households
In terms of married-couple households, the demographic groups most similar to Welsh are Immigrants from Eastern Asia (48.8%, a difference of 0.030%), Immigrants from Iran (48.8%, a difference of 0.050%), Tsimshian (48.7%, a difference of 0.080%), Immigrants from Vietnam (48.8%, a difference of 0.10%), and British (48.7%, a difference of 0.10%).
| Demographics | Rating | Rank | Married-couple Households |
| Sri Lankans | 99.7 /100 | #37 | Exceptional 49.0% |
| Greeks | 99.7 /100 | #38 | Exceptional 48.9% |
| Lithuanians | 99.6 /100 | #39 | Exceptional 48.9% |
| Immigrants | Bolivia | 99.6 /100 | #40 | Exceptional 48.9% |
| Immigrants | Lebanon | 99.6 /100 | #41 | Exceptional 48.9% |
| Immigrants | Vietnam | 99.6 /100 | #42 | Exceptional 48.8% |
| Immigrants | Iran | 99.6 /100 | #43 | Exceptional 48.8% |
| Welsh | 99.5 /100 | #44 | Exceptional 48.8% |
| Immigrants | Eastern Asia | 99.5 /100 | #45 | Exceptional 48.8% |
| Tsimshian | 99.5 /100 | #46 | Exceptional 48.7% |
| British | 99.5 /100 | #47 | Exceptional 48.7% |
| Indians (Asian) | 99.4 /100 | #48 | Exceptional 48.7% |
| Immigrants | Sri Lanka | 99.4 /100 | #49 | Exceptional 48.7% |
| Samoans | 99.4 /100 | #50 | Exceptional 48.7% |
| Eastern Europeans | 99.3 /100 | #51 | Exceptional 48.6% |