Navajo vs Cajun Married-couple Households
COMPARE
Navajo
Cajun
Married-couple Households
Married-couple Households Comparison
Navajo
Cajuns
40.1%
MARRIED-COUPLE HOUSEHOLDS
0.0/ 100
METRIC RATING
324th/ 347
METRIC RANK
46.4%
MARRIED-COUPLE HOUSEHOLDS
45.2/ 100
METRIC RATING
176th/ 347
METRIC RANK
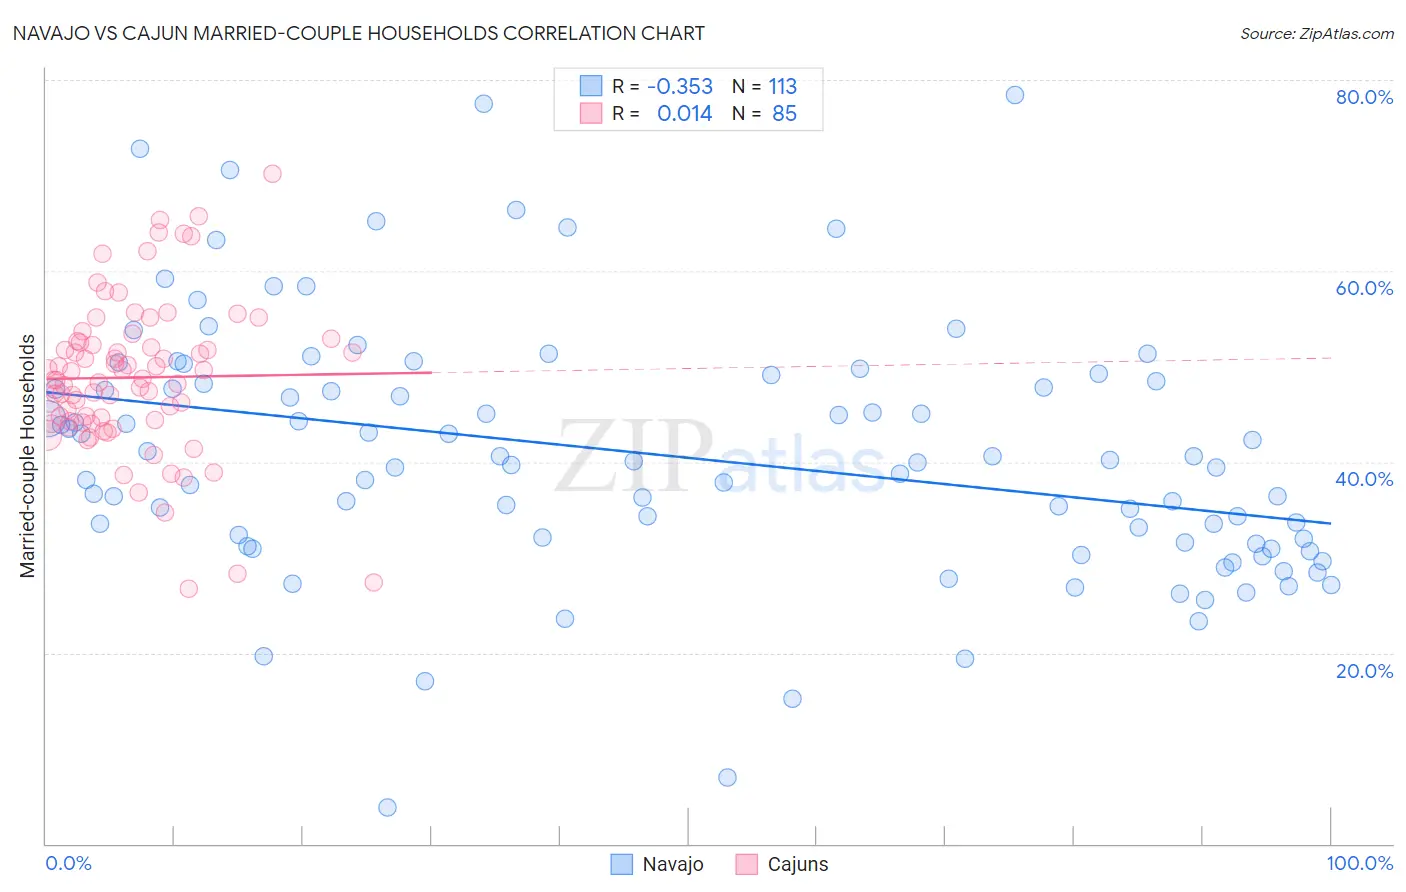
Navajo vs Cajun Married-couple Households Correlation Chart
The statistical analysis conducted on geographies consisting of 224,747,945 people shows a mild negative correlation between the proportion of Navajo and percentage of married-couple family households in the United States with a correlation coefficient (R) of -0.353 and weighted average of 40.1%. Similarly, the statistical analysis conducted on geographies consisting of 149,695,454 people shows no correlation between the proportion of Cajuns and percentage of married-couple family households in the United States with a correlation coefficient (R) of 0.014 and weighted average of 46.4%, a difference of 15.7%.
Married-couple Households Correlation Summary
| Measurement | Navajo | Cajun |
| Minimum | 3.8% | 26.7% |
| Maximum | 78.4% | 70.1% |
| Range | 74.6% | 43.5% |
| Mean | 40.7% | 48.8% |
| Median | 39.9% | 48.6% |
| Interquartile 25% (IQ1) | 31.5% | 44.2% |
| Interquartile 75% (IQ3) | 48.3% | 52.6% |
| Interquartile Range (IQR) | 16.8% | 8.4% |
| Standard Deviation (Sample) | 13.4% | 8.0% |
| Standard Deviation (Population) | 13.3% | 8.0% |
Similar Demographics by Married-couple Households
Demographics Similar to Navajo by Married-couple Households
In terms of married-couple households, the demographic groups most similar to Navajo are Immigrants from Zaire (40.1%, a difference of 0.010%), Puerto Rican (40.1%, a difference of 0.010%), Pueblo (40.0%, a difference of 0.23%), Immigrants from Liberia (40.3%, a difference of 0.67%), and U.S. Virgin Islander (39.8%, a difference of 0.69%).
| Demographics | Rating | Rank | Married-couple Households |
| Immigrants | Jamaica | 0.0 /100 | #317 | Tragic 40.7% |
| Liberians | 0.0 /100 | #318 | Tragic 40.7% |
| Bahamians | 0.0 /100 | #319 | Tragic 40.5% |
| West Indians | 0.0 /100 | #320 | Tragic 40.3% |
| Immigrants | Liberia | 0.0 /100 | #321 | Tragic 40.3% |
| Immigrants | Zaire | 0.0 /100 | #322 | Tragic 40.1% |
| Puerto Ricans | 0.0 /100 | #323 | Tragic 40.1% |
| Navajo | 0.0 /100 | #324 | Tragic 40.1% |
| Pueblo | 0.0 /100 | #325 | Tragic 40.0% |
| U.S. Virgin Islanders | 0.0 /100 | #326 | Tragic 39.8% |
| Lumbee | 0.0 /100 | #327 | Tragic 39.6% |
| Barbadians | 0.0 /100 | #328 | Tragic 39.4% |
| Immigrants | Dominica | 0.0 /100 | #329 | Tragic 39.4% |
| Immigrants | Barbados | 0.0 /100 | #330 | Tragic 39.2% |
| Immigrants | Congo | 0.0 /100 | #331 | Tragic 39.0% |
Demographics Similar to Cajuns by Married-couple Households
In terms of married-couple households, the demographic groups most similar to Cajuns are Immigrants from Colombia (46.4%, a difference of 0.030%), Immigrants (46.3%, a difference of 0.060%), Immigrants from Costa Rica (46.3%, a difference of 0.070%), Immigrants from Zimbabwe (46.3%, a difference of 0.090%), and Mongolian (46.3%, a difference of 0.12%).
| Demographics | Rating | Rank | Married-couple Households |
| Spanish American Indians | 59.4 /100 | #169 | Average 46.6% |
| South Americans | 58.0 /100 | #170 | Average 46.6% |
| Immigrants | Chile | 55.7 /100 | #171 | Average 46.5% |
| Immigrants | Australia | 54.6 /100 | #172 | Average 46.5% |
| Immigrants | Norway | 52.0 /100 | #173 | Average 46.5% |
| Immigrants | Mexico | 50.0 /100 | #174 | Average 46.4% |
| Immigrants | Colombia | 46.1 /100 | #175 | Average 46.4% |
| Cajuns | 45.2 /100 | #176 | Average 46.4% |
| Immigrants | Immigrants | 43.8 /100 | #177 | Average 46.3% |
| Immigrants | Costa Rica | 43.4 /100 | #178 | Average 46.3% |
| Immigrants | Zimbabwe | 43.0 /100 | #179 | Average 46.3% |
| Mongolians | 42.0 /100 | #180 | Average 46.3% |
| Malaysians | 41.8 /100 | #181 | Average 46.3% |
| Yugoslavians | 38.9 /100 | #182 | Fair 46.2% |
| Immigrants | Brazil | 38.3 /100 | #183 | Fair 46.2% |