Navajo vs Immigrants from Scotland Family Households
COMPARE
Navajo
Immigrants from Scotland
Family Households
Family Households Comparison
Navajo
Immigrants from Scotland
66.4%
FAMILY HOUSEHOLDS
100.0/ 100
METRIC RATING
50th/ 347
METRIC RANK
64.7%
FAMILY HOUSEHOLDS
86.4/ 100
METRIC RATING
137th/ 347
METRIC RANK
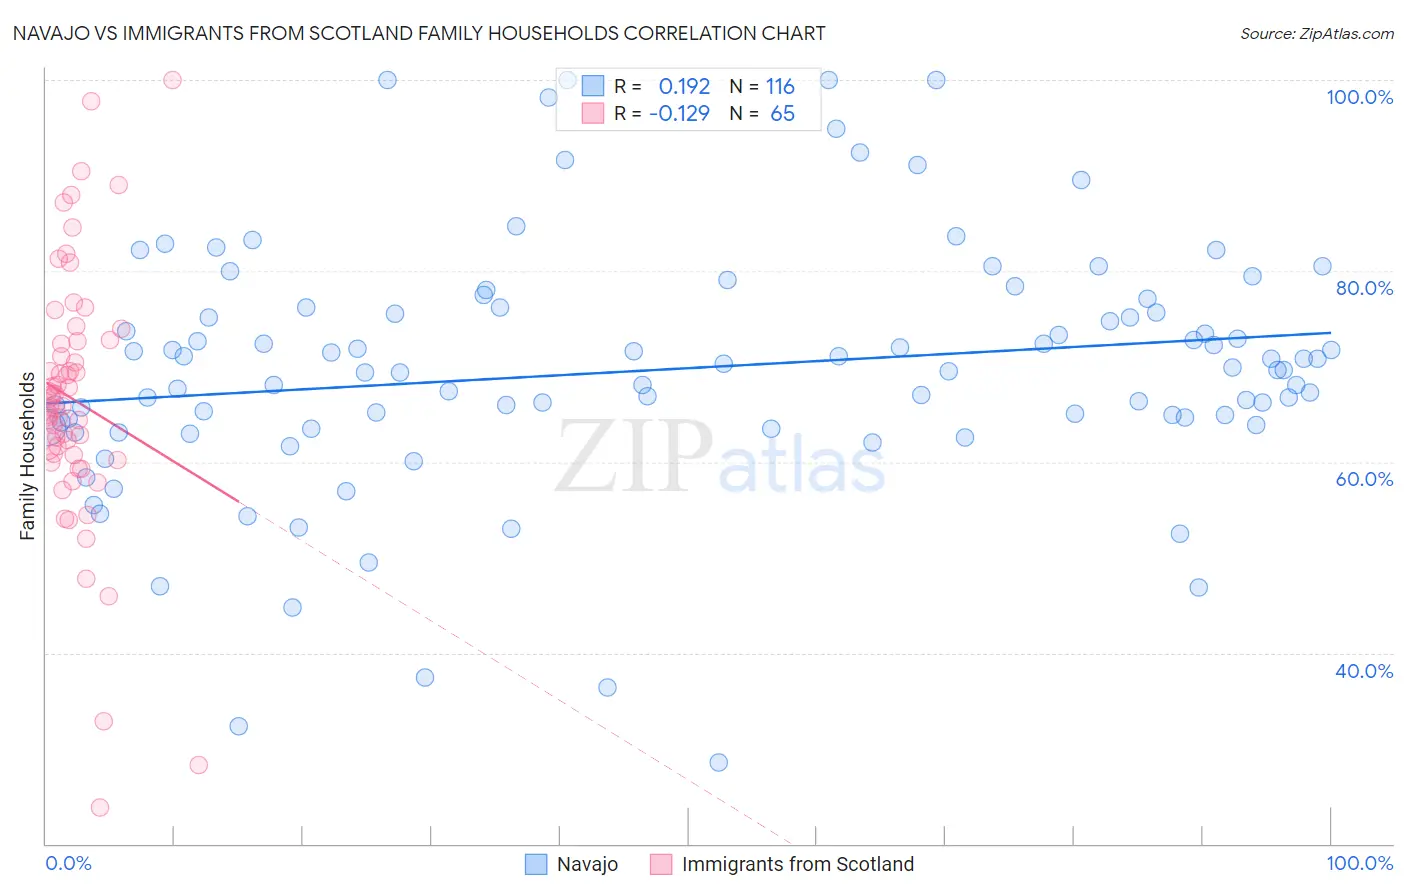
Navajo vs Immigrants from Scotland Family Households Correlation Chart
The statistical analysis conducted on geographies consisting of 224,752,458 people shows a poor positive correlation between the proportion of Navajo and percentage of family households in the United States with a correlation coefficient (R) of 0.192 and weighted average of 66.4%. Similarly, the statistical analysis conducted on geographies consisting of 196,383,501 people shows a poor negative correlation between the proportion of Immigrants from Scotland and percentage of family households in the United States with a correlation coefficient (R) of -0.129 and weighted average of 64.7%, a difference of 2.6%.
Family Households Correlation Summary
| Measurement | Navajo | Immigrants from Scotland |
| Minimum | 28.6% | 23.8% |
| Maximum | 100.0% | 100.0% |
| Range | 71.4% | 76.2% |
| Mean | 69.7% | 66.5% |
| Median | 69.7% | 65.8% |
| Interquartile 25% (IQ1) | 64.0% | 60.5% |
| Interquartile 75% (IQ3) | 75.9% | 72.7% |
| Interquartile Range (IQR) | 11.9% | 12.2% |
| Standard Deviation (Sample) | 13.1% | 13.8% |
| Standard Deviation (Population) | 13.0% | 13.7% |
Similar Demographics by Family Households
Demographics Similar to Navajo by Family Households
In terms of family households, the demographic groups most similar to Navajo are Native/Alaskan (66.4%, a difference of 0.030%), Immigrants from South Central Asia (66.4%, a difference of 0.070%), Immigrants from Venezuela (66.4%, a difference of 0.12%), Bolivian (66.5%, a difference of 0.14%), and Colombian (66.3%, a difference of 0.16%).
| Demographics | Rating | Rank | Family Households |
| Apache | 100.0 /100 | #43 | Exceptional 66.5% |
| Asians | 100.0 /100 | #44 | Exceptional 66.5% |
| Venezuelans | 100.0 /100 | #45 | Exceptional 66.5% |
| Arapaho | 100.0 /100 | #46 | Exceptional 66.5% |
| Bolivians | 100.0 /100 | #47 | Exceptional 66.5% |
| Immigrants | Venezuela | 100.0 /100 | #48 | Exceptional 66.4% |
| Immigrants | South Central Asia | 100.0 /100 | #49 | Exceptional 66.4% |
| Navajo | 100.0 /100 | #50 | Exceptional 66.4% |
| Natives/Alaskans | 100.0 /100 | #51 | Exceptional 66.4% |
| Colombians | 100.0 /100 | #52 | Exceptional 66.3% |
| Afghans | 100.0 /100 | #53 | Exceptional 66.3% |
| Immigrants | Colombia | 100.0 /100 | #54 | Exceptional 66.3% |
| Immigrants | Immigrants | 100.0 /100 | #55 | Exceptional 66.1% |
| Immigrants | Hong Kong | 100.0 /100 | #56 | Exceptional 66.1% |
| Pennsylvania Germans | 100.0 /100 | #57 | Exceptional 66.1% |
Demographics Similar to Immigrants from Scotland by Family Households
In terms of family households, the demographic groups most similar to Immigrants from Scotland are Immigrants from China (64.7%, a difference of 0.010%), Basque (64.7%, a difference of 0.020%), Maltese (64.7%, a difference of 0.030%), Immigrants from Jamaica (64.7%, a difference of 0.030%), and Immigrants from North Macedonia (64.7%, a difference of 0.040%).
| Demographics | Rating | Rank | Family Households |
| Immigrants | Italy | 90.2 /100 | #130 | Exceptional 64.8% |
| Immigrants | Nonimmigrants | 90.1 /100 | #131 | Exceptional 64.8% |
| Cajuns | 89.4 /100 | #132 | Excellent 64.8% |
| Belizeans | 89.3 /100 | #133 | Excellent 64.8% |
| Greeks | 88.1 /100 | #134 | Excellent 64.7% |
| Maltese | 87.4 /100 | #135 | Excellent 64.7% |
| Immigrants | China | 86.6 /100 | #136 | Excellent 64.7% |
| Immigrants | Scotland | 86.4 /100 | #137 | Excellent 64.7% |
| Basques | 85.5 /100 | #138 | Excellent 64.7% |
| Immigrants | Jamaica | 85.3 /100 | #139 | Excellent 64.7% |
| Immigrants | North Macedonia | 84.9 /100 | #140 | Excellent 64.7% |
| Immigrants | Cameroon | 84.8 /100 | #141 | Excellent 64.7% |
| Pakistanis | 84.0 /100 | #142 | Excellent 64.7% |
| Czechoslovakians | 82.1 /100 | #143 | Excellent 64.6% |
| South American Indians | 81.9 /100 | #144 | Excellent 64.6% |