Native/Alaskan vs Spaniard Single Father Households
COMPARE
Native/Alaskan
Spaniard
Single Father Households
Single Father Households Comparison
Natives/Alaskans
Spaniards
3.2%
SINGLE FATHER HOUSEHOLDS
0.0/ 100
METRIC RATING
333rd/ 347
METRIC RANK
2.5%
SINGLE FATHER HOUSEHOLDS
3.1/ 100
METRIC RATING
243rd/ 347
METRIC RANK
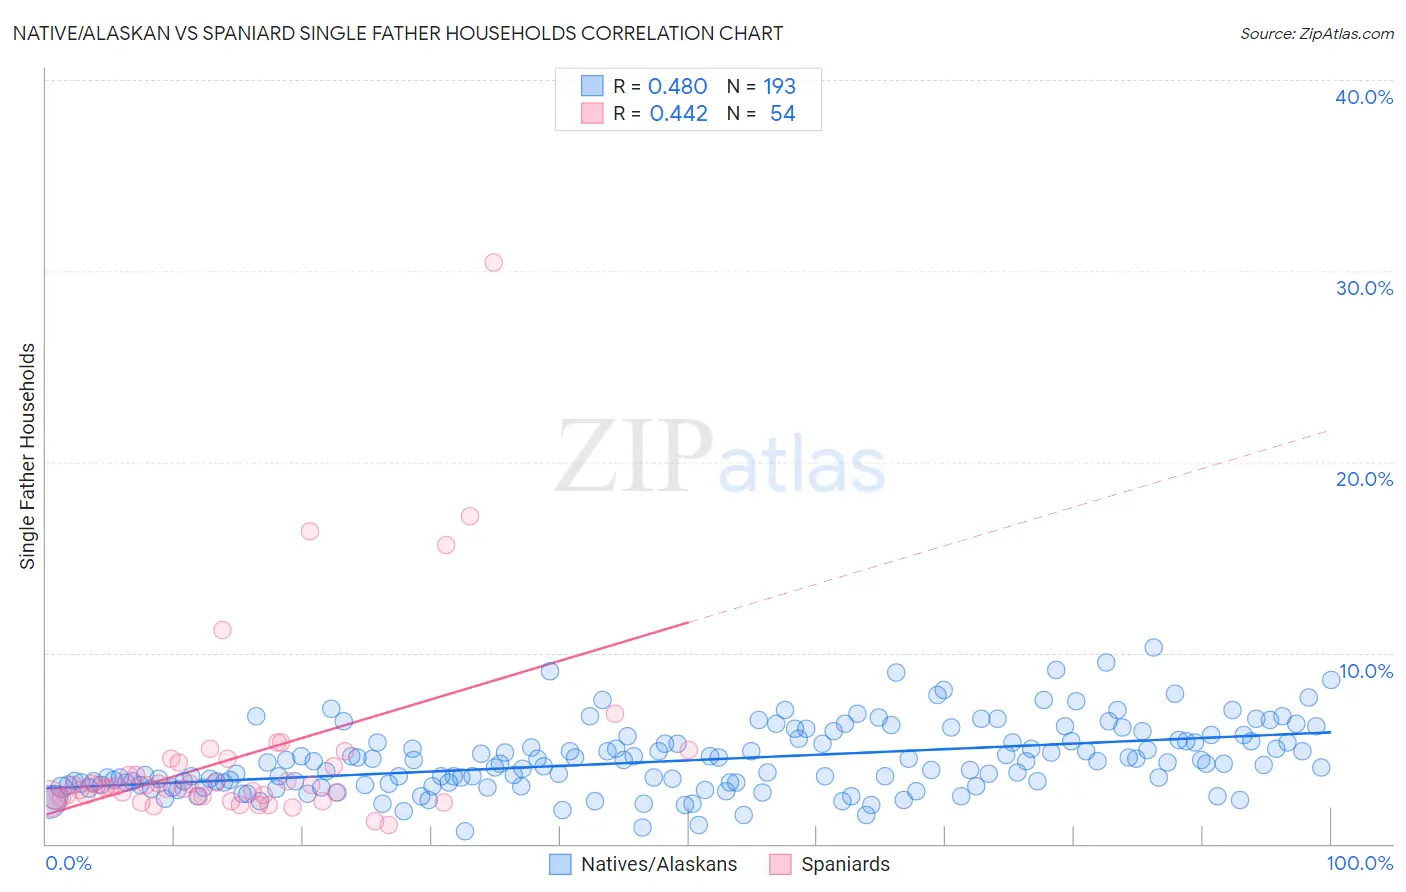
Native/Alaskan vs Spaniard Single Father Households Correlation Chart
The statistical analysis conducted on geographies consisting of 505,226,319 people shows a moderate positive correlation between the proportion of Natives/Alaskans and percentage of single father households in the United States with a correlation coefficient (R) of 0.480 and weighted average of 3.2%. Similarly, the statistical analysis conducted on geographies consisting of 438,543,762 people shows a moderate positive correlation between the proportion of Spaniards and percentage of single father households in the United States with a correlation coefficient (R) of 0.442 and weighted average of 2.5%, a difference of 29.0%.
Single Father Households Correlation Summary
| Measurement | Native/Alaskan | Spaniard |
| Minimum | 0.64% | 1.0% |
| Maximum | 10.3% | 30.4% |
| Range | 9.6% | 29.4% |
| Mean | 4.4% | 4.5% |
| Median | 4.1% | 3.0% |
| Interquartile 25% (IQ1) | 3.1% | 2.4% |
| Interquartile 75% (IQ3) | 5.4% | 4.2% |
| Interquartile Range (IQR) | 2.3% | 1.8% |
| Standard Deviation (Sample) | 1.8% | 5.0% |
| Standard Deviation (Population) | 1.8% | 4.9% |
Similar Demographics by Single Father Households
Demographics Similar to Natives/Alaskans by Single Father Households
In terms of single father households, the demographic groups most similar to Natives/Alaskans are Yaqui (3.2%, a difference of 0.49%), Navajo (3.2%, a difference of 0.54%), Yuman (3.3%, a difference of 2.8%), Colville (3.3%, a difference of 2.8%), and Paiute (3.3%, a difference of 2.8%).
| Demographics | Rating | Rank | Single Father Households |
| Aleuts | 0.0 /100 | #326 | Tragic 3.0% |
| Bangladeshis | 0.0 /100 | #327 | Tragic 3.1% |
| Immigrants | Cabo Verde | 0.0 /100 | #328 | Tragic 3.1% |
| Chippewa | 0.0 /100 | #329 | Tragic 3.1% |
| Nepalese | 0.0 /100 | #330 | Tragic 3.1% |
| Navajo | 0.0 /100 | #331 | Tragic 3.2% |
| Yaqui | 0.0 /100 | #332 | Tragic 3.2% |
| Natives/Alaskans | 0.0 /100 | #333 | Tragic 3.2% |
| Yuman | 0.0 /100 | #334 | Tragic 3.3% |
| Colville | 0.0 /100 | #335 | Tragic 3.3% |
| Paiute | 0.0 /100 | #336 | Tragic 3.3% |
| Pueblo | 0.0 /100 | #337 | Tragic 3.3% |
| Sioux | 0.0 /100 | #338 | Tragic 3.3% |
| Alaskan Athabascans | 0.0 /100 | #339 | Tragic 3.4% |
| Alaska Natives | 0.0 /100 | #340 | Tragic 3.5% |
Demographics Similar to Spaniards by Single Father Households
In terms of single father households, the demographic groups most similar to Spaniards are Immigrants from Middle Africa (2.5%, a difference of 0.19%), Basque (2.5%, a difference of 0.39%), Native Hawaiian (2.5%, a difference of 0.41%), Delaware (2.5%, a difference of 0.43%), and Osage (2.5%, a difference of 0.46%).
| Demographics | Rating | Rank | Single Father Households |
| Cajuns | 6.1 /100 | #236 | Tragic 2.5% |
| Sierra Leoneans | 5.9 /100 | #237 | Tragic 2.5% |
| Immigrants | Sierra Leone | 5.8 /100 | #238 | Tragic 2.5% |
| Immigrants | Oceania | 5.8 /100 | #239 | Tragic 2.5% |
| Immigrants | Dominica | 4.8 /100 | #240 | Tragic 2.5% |
| Portuguese | 4.1 /100 | #241 | Tragic 2.5% |
| Osage | 4.1 /100 | #242 | Tragic 2.5% |
| Spaniards | 3.1 /100 | #243 | Tragic 2.5% |
| Immigrants | Middle Africa | 2.8 /100 | #244 | Tragic 2.5% |
| Basques | 2.5 /100 | #245 | Tragic 2.5% |
| Native Hawaiians | 2.5 /100 | #246 | Tragic 2.5% |
| Delaware | 2.5 /100 | #247 | Tragic 2.5% |
| Bahamians | 2.4 /100 | #248 | Tragic 2.5% |
| Immigrants | Cameroon | 2.3 /100 | #249 | Tragic 2.5% |
| Somalis | 2.1 /100 | #250 | Tragic 2.5% |