Native/Alaskan vs Spaniard In Labor Force | Age 16-19
COMPARE
Native/Alaskan
Spaniard
In Labor Force | Age 16-19
In Labor Force | Age 16-19 Comparison
Natives/Alaskans
Spaniards
36.6%
IN LABOR FORCE | AGE 16-19
49.0/ 100
METRIC RATING
175th/ 347
METRIC RANK
38.0%
IN LABOR FORCE | AGE 16-19
95.5/ 100
METRIC RATING
129th/ 347
METRIC RANK
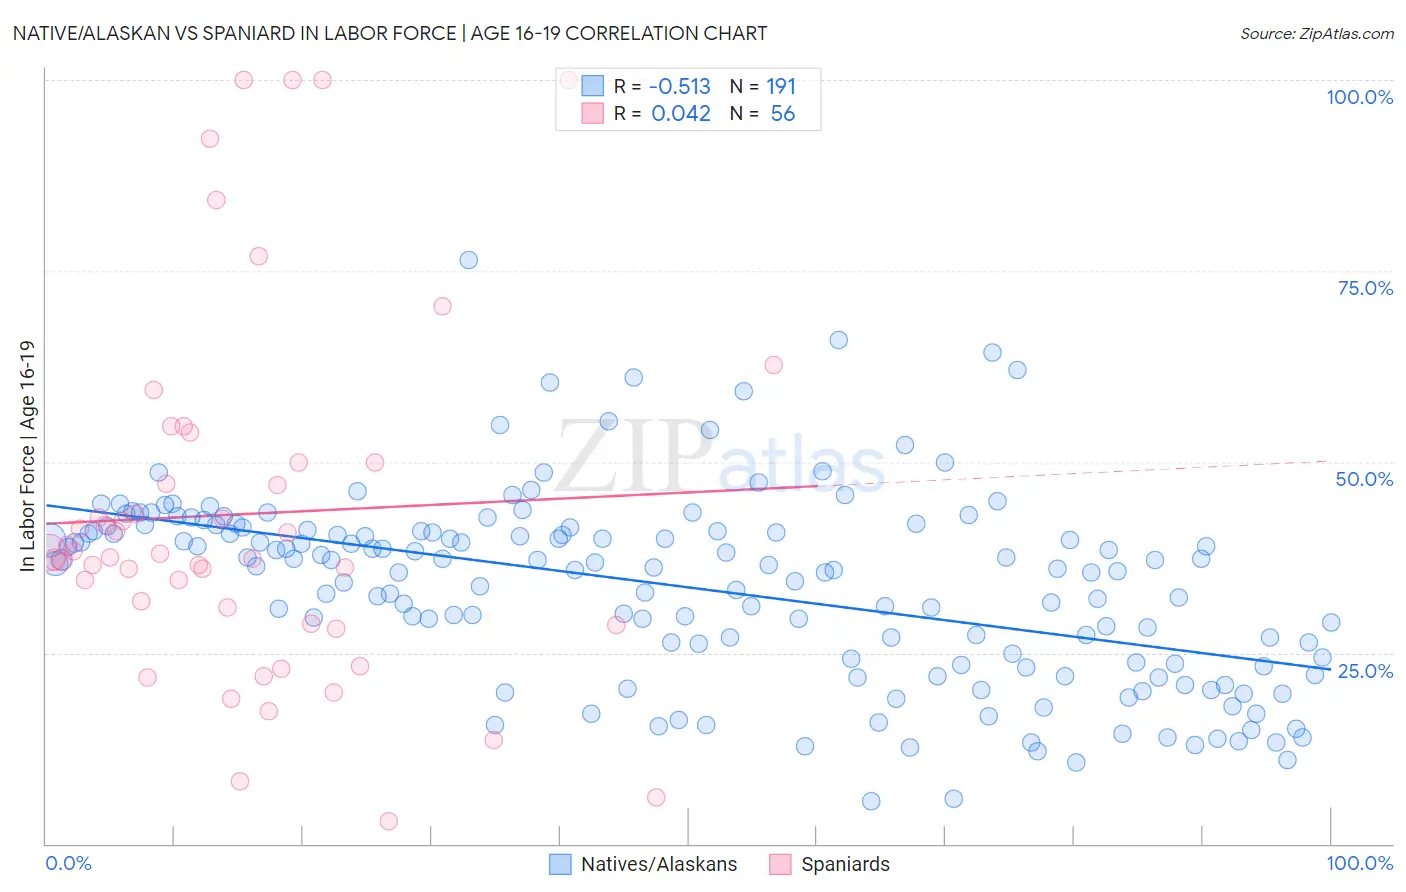
Native/Alaskan vs Spaniard In Labor Force | Age 16-19 Correlation Chart
The statistical analysis conducted on geographies consisting of 511,038,872 people shows a substantial negative correlation between the proportion of Natives/Alaskans and labor force participation rate among population between the ages 16 and 19 in the United States with a correlation coefficient (R) of -0.513 and weighted average of 36.6%. Similarly, the statistical analysis conducted on geographies consisting of 442,456,535 people shows no correlation between the proportion of Spaniards and labor force participation rate among population between the ages 16 and 19 in the United States with a correlation coefficient (R) of 0.042 and weighted average of 38.0%, a difference of 3.9%.
In Labor Force | Age 16-19 Correlation Summary
| Measurement | Native/Alaskan | Spaniard |
| Minimum | 5.5% | 3.0% |
| Maximum | 76.4% | 100.0% |
| Range | 70.9% | 97.0% |
| Mean | 33.6% | 43.2% |
| Median | 36.4% | 38.1% |
| Interquartile 25% (IQ1) | 23.7% | 29.9% |
| Interquartile 75% (IQ3) | 41.0% | 50.0% |
| Interquartile Range (IQR) | 17.3% | 20.1% |
| Standard Deviation (Sample) | 12.4% | 23.4% |
| Standard Deviation (Population) | 12.3% | 23.2% |
Similar Demographics by In Labor Force | Age 16-19
Demographics Similar to Natives/Alaskans by In Labor Force | Age 16-19
In terms of in labor force | age 16-19, the demographic groups most similar to Natives/Alaskans are Albanian (36.5%, a difference of 0.010%), Immigrants from Czechoslovakia (36.6%, a difference of 0.050%), Immigrants from Northern Europe (36.5%, a difference of 0.12%), Black/African American (36.5%, a difference of 0.20%), and Immigrants from Southern Europe (36.4%, a difference of 0.29%).
| Demographics | Rating | Rank | In Labor Force | Age 16-19 |
| Palestinians | 63.1 /100 | #168 | Good 36.8% |
| Immigrants | Latvia | 61.6 /100 | #169 | Good 36.8% |
| Immigrants | South Africa | 60.5 /100 | #170 | Good 36.8% |
| Immigrants | Cambodia | 58.4 /100 | #171 | Average 36.7% |
| South Africans | 58.3 /100 | #172 | Average 36.7% |
| Russians | 57.5 /100 | #173 | Average 36.7% |
| Immigrants | Czechoslovakia | 50.0 /100 | #174 | Average 36.6% |
| Natives/Alaskans | 49.0 /100 | #175 | Average 36.6% |
| Albanians | 48.8 /100 | #176 | Average 36.5% |
| Immigrants | Northern Europe | 46.6 /100 | #177 | Average 36.5% |
| Blacks/African Americans | 45.1 /100 | #178 | Average 36.5% |
| Immigrants | Southern Europe | 43.3 /100 | #179 | Average 36.4% |
| Immigrants | Morocco | 41.1 /100 | #180 | Average 36.4% |
| Jordanians | 39.6 /100 | #181 | Fair 36.4% |
| Immigrants | Italy | 39.1 /100 | #182 | Fair 36.4% |
Demographics Similar to Spaniards by In Labor Force | Age 16-19
In terms of in labor force | age 16-19, the demographic groups most similar to Spaniards are New Zealander (38.0%, a difference of 0.020%), African (38.0%, a difference of 0.030%), Choctaw (38.0%, a difference of 0.030%), Immigrants from Zimbabwe (38.0%, a difference of 0.030%), and Immigrants from Austria (37.9%, a difference of 0.12%).
| Demographics | Rating | Rank | In Labor Force | Age 16-19 |
| Guamanians/Chamorros | 97.4 /100 | #122 | Exceptional 38.2% |
| Seminole | 96.7 /100 | #123 | Exceptional 38.1% |
| Immigrants | England | 96.4 /100 | #124 | Exceptional 38.1% |
| Immigrants | Africa | 96.1 /100 | #125 | Exceptional 38.0% |
| Africans | 95.6 /100 | #126 | Exceptional 38.0% |
| Choctaw | 95.6 /100 | #127 | Exceptional 38.0% |
| New Zealanders | 95.6 /100 | #128 | Exceptional 38.0% |
| Spaniards | 95.5 /100 | #129 | Exceptional 38.0% |
| Immigrants | Zimbabwe | 95.4 /100 | #130 | Exceptional 38.0% |
| Immigrants | Austria | 95.0 /100 | #131 | Exceptional 37.9% |
| Immigrants | Oceania | 94.7 /100 | #132 | Exceptional 37.9% |
| Cheyenne | 94.6 /100 | #133 | Exceptional 37.9% |
| Immigrants | Netherlands | 93.7 /100 | #134 | Exceptional 37.8% |
| Macedonians | 93.4 /100 | #135 | Exceptional 37.8% |
| Australians | 93.2 /100 | #136 | Exceptional 37.8% |