Mongolian vs Native Hawaiian Divorced or Separated
COMPARE
Mongolian
Native Hawaiian
Divorced or Separated
Divorced or Separated Comparison
Mongolians
Native Hawaiians
11.1%
DIVORCED OR SEPARATED
100.0/ 100
METRIC RATING
31st/ 347
METRIC RANK
11.7%
DIVORCED OR SEPARATED
97.2/ 100
METRIC RATING
107th/ 347
METRIC RANK
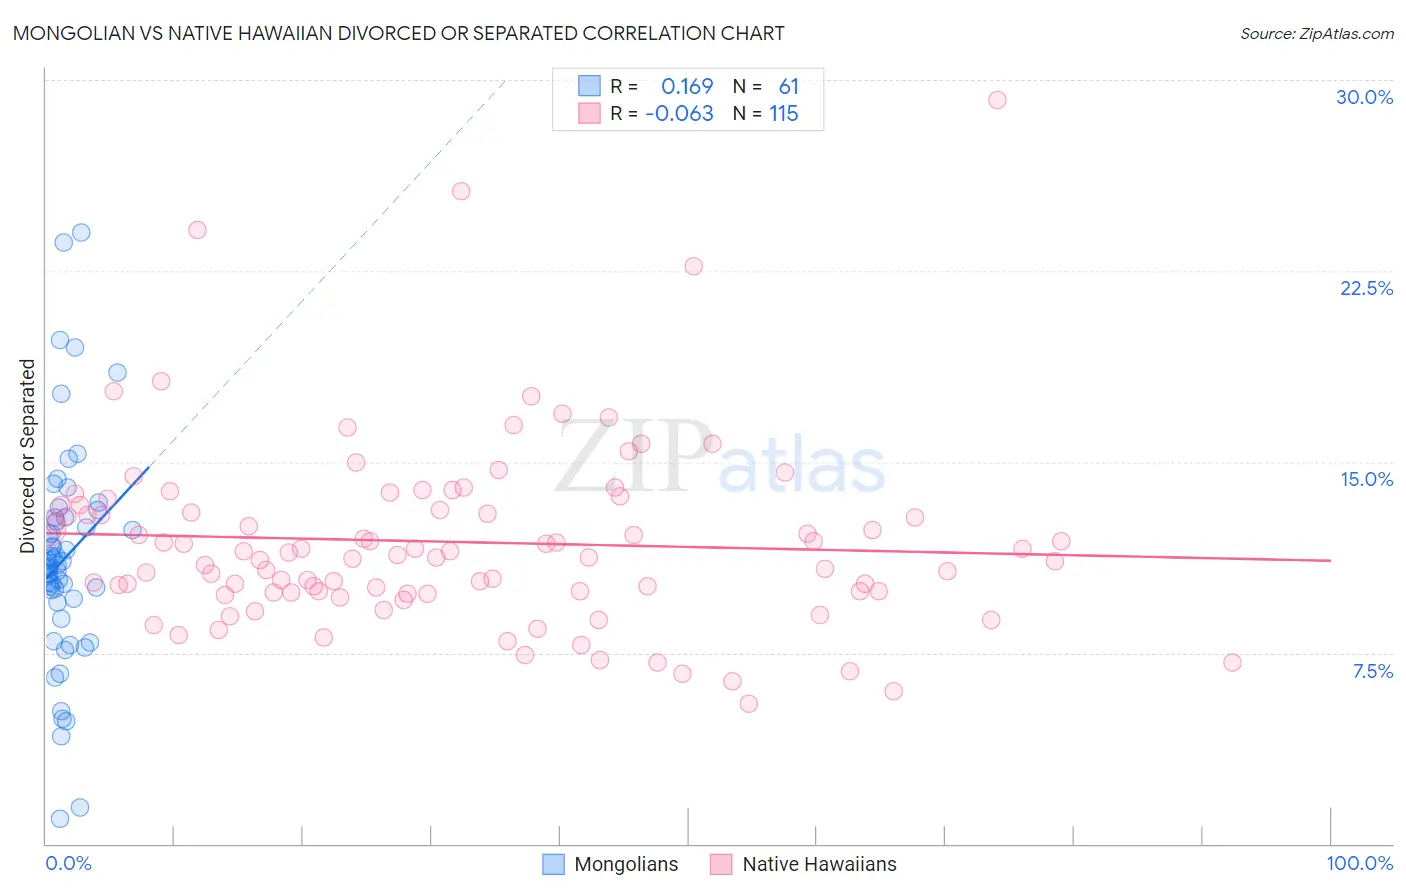
Mongolian vs Native Hawaiian Divorced or Separated Correlation Chart
The statistical analysis conducted on geographies consisting of 140,326,151 people shows a poor positive correlation between the proportion of Mongolians and percentage of population currently divorced or separated in the United States with a correlation coefficient (R) of 0.169 and weighted average of 11.1%. Similarly, the statistical analysis conducted on geographies consisting of 331,991,135 people shows a slight negative correlation between the proportion of Native Hawaiians and percentage of population currently divorced or separated in the United States with a correlation coefficient (R) of -0.063 and weighted average of 11.7%, a difference of 5.6%.
Divorced or Separated Correlation Summary
| Measurement | Mongolian | Native Hawaiian |
| Minimum | 1.0% | 5.5% |
| Maximum | 24.0% | 29.2% |
| Range | 23.0% | 23.7% |
| Mean | 11.2% | 11.9% |
| Median | 10.9% | 11.3% |
| Interquartile 25% (IQ1) | 9.5% | 9.9% |
| Interquartile 75% (IQ3) | 12.8% | 13.3% |
| Interquartile Range (IQR) | 3.3% | 3.4% |
| Standard Deviation (Sample) | 4.3% | 3.7% |
| Standard Deviation (Population) | 4.3% | 3.7% |
Similar Demographics by Divorced or Separated
Demographics Similar to Mongolians by Divorced or Separated
In terms of divorced or separated, the demographic groups most similar to Mongolians are Tongan (11.1%, a difference of 0.080%), Egyptian (11.1%, a difference of 0.12%), Immigrants from Uzbekistan (11.1%, a difference of 0.19%), Cambodian (11.1%, a difference of 0.27%), and Immigrants from Ireland (11.0%, a difference of 0.30%).
| Demographics | Rating | Rank | Divorced or Separated |
| Immigrants | Sri Lanka | 100.0 /100 | #24 | Exceptional 10.8% |
| Iranians | 100.0 /100 | #25 | Exceptional 10.8% |
| Immigrants | Indonesia | 100.0 /100 | #26 | Exceptional 10.9% |
| Immigrants | Bangladesh | 100.0 /100 | #27 | Exceptional 11.0% |
| Immigrants | Malaysia | 100.0 /100 | #28 | Exceptional 11.0% |
| Armenians | 100.0 /100 | #29 | Exceptional 11.0% |
| Immigrants | Ireland | 100.0 /100 | #30 | Exceptional 11.0% |
| Mongolians | 100.0 /100 | #31 | Exceptional 11.1% |
| Tongans | 100.0 /100 | #32 | Exceptional 11.1% |
| Egyptians | 100.0 /100 | #33 | Exceptional 11.1% |
| Immigrants | Uzbekistan | 100.0 /100 | #34 | Exceptional 11.1% |
| Cambodians | 100.0 /100 | #35 | Exceptional 11.1% |
| Immigrants | Japan | 100.0 /100 | #36 | Exceptional 11.1% |
| Immigrants | Lebanon | 100.0 /100 | #37 | Exceptional 11.1% |
| Immigrants | Greece | 100.0 /100 | #38 | Exceptional 11.1% |
Demographics Similar to Native Hawaiians by Divorced or Separated
In terms of divorced or separated, the demographic groups most similar to Native Hawaiians are Greek (11.7%, a difference of 0.090%), Immigrants from South Africa (11.7%, a difference of 0.10%), Immigrants from Czechoslovakia (11.7%, a difference of 0.10%), Immigrants from Spain (11.7%, a difference of 0.14%), and Immigrants from France (11.7%, a difference of 0.19%).
| Demographics | Rating | Rank | Divorced or Separated |
| Immigrants | Northern Europe | 98.6 /100 | #100 | Exceptional 11.6% |
| Immigrants | Guyana | 98.5 /100 | #101 | Exceptional 11.6% |
| Immigrants | Croatia | 98.3 /100 | #102 | Exceptional 11.6% |
| Maltese | 98.2 /100 | #103 | Exceptional 11.6% |
| Salvadorans | 98.2 /100 | #104 | Exceptional 11.6% |
| Immigrants | El Salvador | 97.9 /100 | #105 | Exceptional 11.7% |
| Immigrants | Kazakhstan | 97.8 /100 | #106 | Exceptional 11.7% |
| Native Hawaiians | 97.2 /100 | #107 | Exceptional 11.7% |
| Greeks | 96.9 /100 | #108 | Exceptional 11.7% |
| Immigrants | South Africa | 96.9 /100 | #109 | Exceptional 11.7% |
| Immigrants | Czechoslovakia | 96.9 /100 | #110 | Exceptional 11.7% |
| Immigrants | Spain | 96.8 /100 | #111 | Exceptional 11.7% |
| Immigrants | France | 96.6 /100 | #112 | Exceptional 11.7% |
| Estonians | 96.6 /100 | #113 | Exceptional 11.7% |
| Immigrants | Norway | 95.9 /100 | #114 | Exceptional 11.7% |