Japanese vs Native Hawaiian Divorced or Separated
COMPARE
Japanese
Native Hawaiian
Divorced or Separated
Divorced or Separated Comparison
Japanese
Native Hawaiians
12.0%
DIVORCED OR SEPARATED
70.9/ 100
METRIC RATING
155th/ 347
METRIC RANK
11.7%
DIVORCED OR SEPARATED
97.2/ 100
METRIC RATING
107th/ 347
METRIC RANK
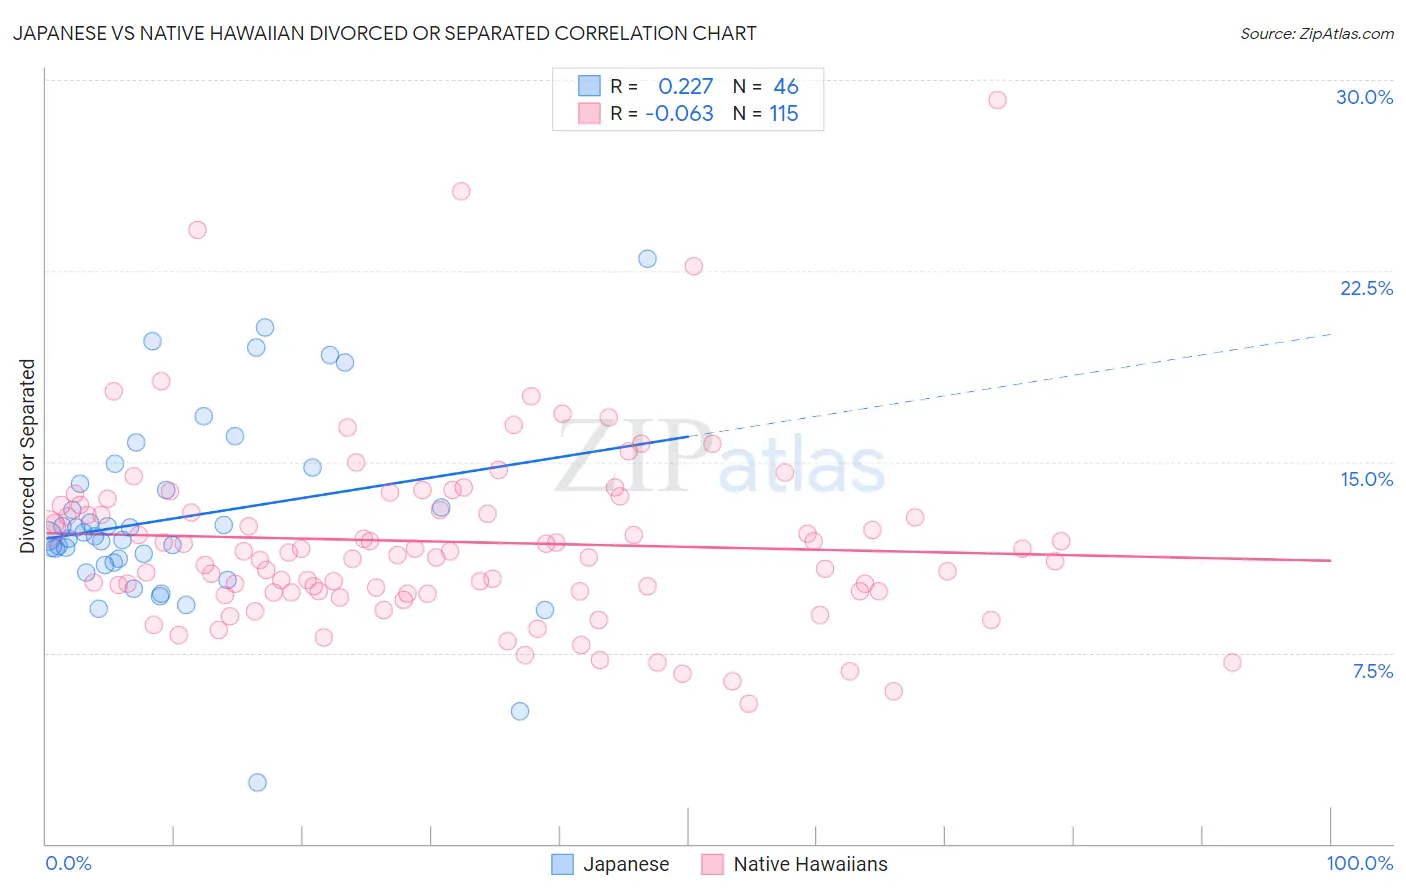
Japanese vs Native Hawaiian Divorced or Separated Correlation Chart
The statistical analysis conducted on geographies consisting of 249,125,963 people shows a weak positive correlation between the proportion of Japanese and percentage of population currently divorced or separated in the United States with a correlation coefficient (R) of 0.227 and weighted average of 12.0%. Similarly, the statistical analysis conducted on geographies consisting of 331,991,135 people shows a slight negative correlation between the proportion of Native Hawaiians and percentage of population currently divorced or separated in the United States with a correlation coefficient (R) of -0.063 and weighted average of 11.7%, a difference of 2.4%.
Divorced or Separated Correlation Summary
| Measurement | Japanese | Native Hawaiian |
| Minimum | 2.4% | 5.5% |
| Maximum | 23.0% | 29.2% |
| Range | 20.6% | 23.7% |
| Mean | 12.8% | 11.9% |
| Median | 12.1% | 11.3% |
| Interquartile 25% (IQ1) | 11.1% | 9.9% |
| Interquartile 75% (IQ3) | 14.1% | 13.3% |
| Interquartile Range (IQR) | 3.1% | 3.4% |
| Standard Deviation (Sample) | 3.8% | 3.7% |
| Standard Deviation (Population) | 3.7% | 3.7% |
Similar Demographics by Divorced or Separated
Demographics Similar to Japanese by Divorced or Separated
In terms of divorced or separated, the demographic groups most similar to Japanese are Chilean (12.0%, a difference of 0.020%), Hungarian (12.0%, a difference of 0.020%), Austrian (12.0%, a difference of 0.060%), Immigrants from Brazil (12.0%, a difference of 0.090%), and Immigrants from Hungary (11.9%, a difference of 0.12%).
| Demographics | Rating | Rank | Divorced or Separated |
| Italians | 77.8 /100 | #148 | Good 11.9% |
| Immigrants | Oceania | 77.7 /100 | #149 | Good 11.9% |
| Immigrants | Portugal | 77.3 /100 | #150 | Good 11.9% |
| Czechs | 76.4 /100 | #151 | Good 11.9% |
| Immigrants | Hungary | 73.7 /100 | #152 | Good 11.9% |
| Austrians | 72.2 /100 | #153 | Good 12.0% |
| Chileans | 71.3 /100 | #154 | Good 12.0% |
| Japanese | 70.9 /100 | #155 | Good 12.0% |
| Hungarians | 70.3 /100 | #156 | Good 12.0% |
| Immigrants | Brazil | 68.8 /100 | #157 | Good 12.0% |
| Icelanders | 66.0 /100 | #158 | Good 12.0% |
| Immigrants | Barbados | 66.0 /100 | #159 | Good 12.0% |
| Immigrants | Scotland | 65.8 /100 | #160 | Good 12.0% |
| Marshallese | 64.6 /100 | #161 | Good 12.0% |
| Samoans | 64.3 /100 | #162 | Good 12.0% |
Demographics Similar to Native Hawaiians by Divorced or Separated
In terms of divorced or separated, the demographic groups most similar to Native Hawaiians are Greek (11.7%, a difference of 0.090%), Immigrants from South Africa (11.7%, a difference of 0.10%), Immigrants from Czechoslovakia (11.7%, a difference of 0.10%), Immigrants from Spain (11.7%, a difference of 0.14%), and Immigrants from France (11.7%, a difference of 0.19%).
| Demographics | Rating | Rank | Divorced or Separated |
| Immigrants | Northern Europe | 98.6 /100 | #100 | Exceptional 11.6% |
| Immigrants | Guyana | 98.5 /100 | #101 | Exceptional 11.6% |
| Immigrants | Croatia | 98.3 /100 | #102 | Exceptional 11.6% |
| Maltese | 98.2 /100 | #103 | Exceptional 11.6% |
| Salvadorans | 98.2 /100 | #104 | Exceptional 11.6% |
| Immigrants | El Salvador | 97.9 /100 | #105 | Exceptional 11.7% |
| Immigrants | Kazakhstan | 97.8 /100 | #106 | Exceptional 11.7% |
| Native Hawaiians | 97.2 /100 | #107 | Exceptional 11.7% |
| Greeks | 96.9 /100 | #108 | Exceptional 11.7% |
| Immigrants | South Africa | 96.9 /100 | #109 | Exceptional 11.7% |
| Immigrants | Czechoslovakia | 96.9 /100 | #110 | Exceptional 11.7% |
| Immigrants | Spain | 96.8 /100 | #111 | Exceptional 11.7% |
| Immigrants | France | 96.6 /100 | #112 | Exceptional 11.7% |
| Estonians | 96.6 /100 | #113 | Exceptional 11.7% |
| Immigrants | Norway | 95.9 /100 | #114 | Exceptional 11.7% |