Immigrants from Southern Europe vs Native Hawaiian Divorced or Separated
COMPARE
Immigrants from Southern Europe
Native Hawaiian
Divorced or Separated
Divorced or Separated Comparison
Immigrants from Southern Europe
Native Hawaiians
11.6%
DIVORCED OR SEPARATED
99.1/ 100
METRIC RATING
89th/ 347
METRIC RANK
11.7%
DIVORCED OR SEPARATED
97.2/ 100
METRIC RATING
107th/ 347
METRIC RANK
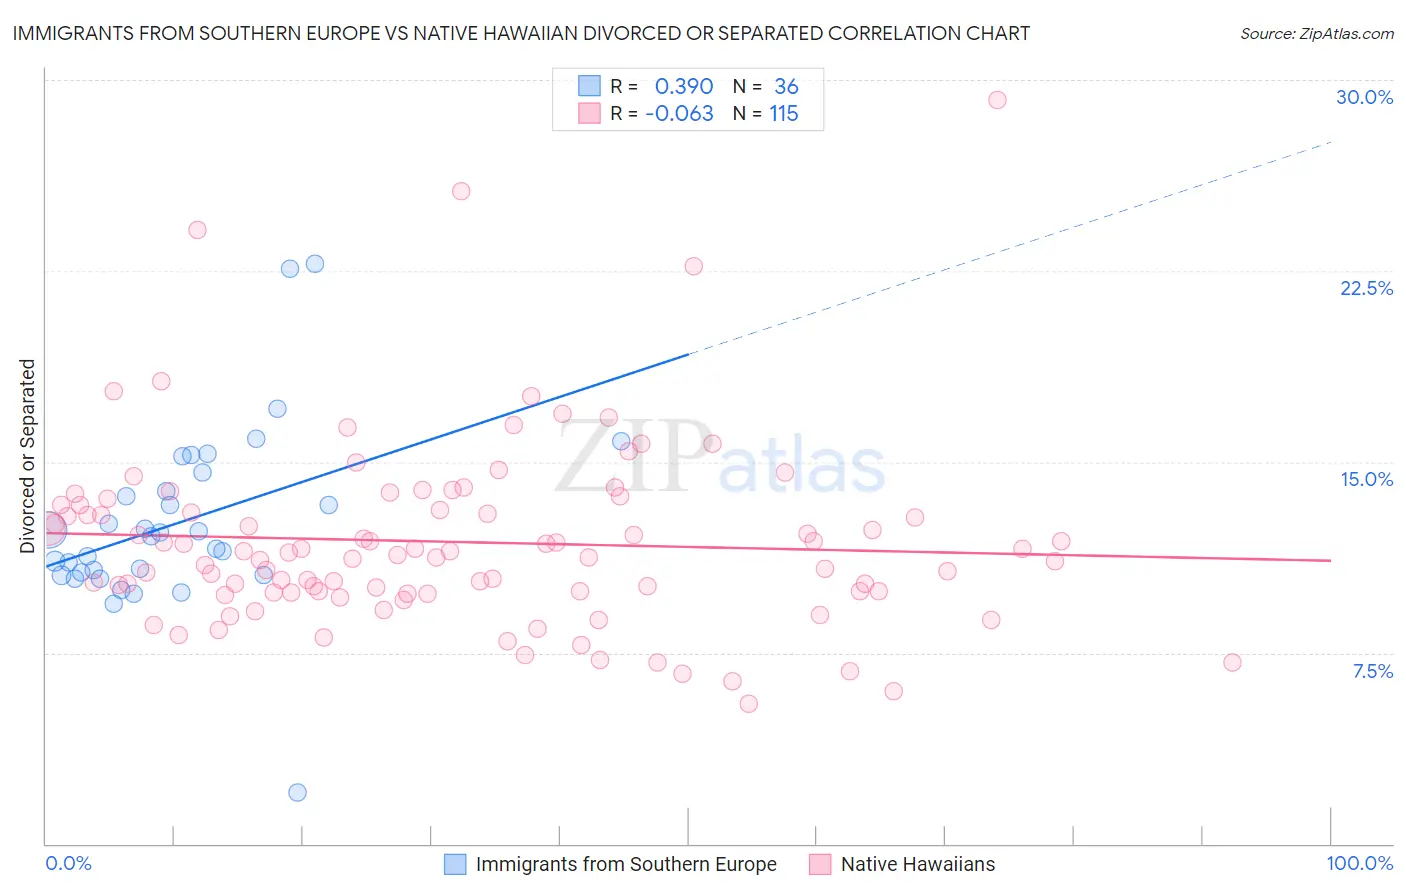
Immigrants from Southern Europe vs Native Hawaiian Divorced or Separated Correlation Chart
The statistical analysis conducted on geographies consisting of 402,653,833 people shows a mild positive correlation between the proportion of Immigrants from Southern Europe and percentage of population currently divorced or separated in the United States with a correlation coefficient (R) of 0.390 and weighted average of 11.6%. Similarly, the statistical analysis conducted on geographies consisting of 331,991,135 people shows a slight negative correlation between the proportion of Native Hawaiians and percentage of population currently divorced or separated in the United States with a correlation coefficient (R) of -0.063 and weighted average of 11.7%, a difference of 1.1%.
Divorced or Separated Correlation Summary
| Measurement | Immigrants from Southern Europe | Native Hawaiian |
| Minimum | 2.0% | 5.5% |
| Maximum | 22.8% | 29.2% |
| Range | 20.8% | 23.7% |
| Mean | 12.6% | 11.9% |
| Median | 12.1% | 11.3% |
| Interquartile 25% (IQ1) | 10.6% | 9.9% |
| Interquartile 75% (IQ3) | 14.2% | 13.3% |
| Interquartile Range (IQR) | 3.6% | 3.4% |
| Standard Deviation (Sample) | 3.6% | 3.7% |
| Standard Deviation (Population) | 3.6% | 3.7% |
Demographics Similar to Immigrants from Southern Europe and Native Hawaiians by Divorced or Separated
In terms of divorced or separated, the demographic groups most similar to Immigrants from Southern Europe are Immigrants from Europe (11.6%, a difference of 0.040%), Zimbabwean (11.6%, a difference of 0.10%), Spanish American Indian (11.6%, a difference of 0.14%), Immigrants from Denmark (11.6%, a difference of 0.20%), and Arab (11.6%, a difference of 0.20%). Similarly, the demographic groups most similar to Native Hawaiians are Greek (11.7%, a difference of 0.090%), Immigrants from Kazakhstan (11.7%, a difference of 0.21%), Immigrants from El Salvador (11.7%, a difference of 0.25%), Salvadoran (11.6%, a difference of 0.37%), and Maltese (11.6%, a difference of 0.39%).
| Demographics | Rating | Rank | Divorced or Separated |
| Immigrants | Europe | 99.2 /100 | #88 | Exceptional 11.6% |
| Immigrants | Southern Europe | 99.1 /100 | #89 | Exceptional 11.6% |
| Zimbabweans | 99.0 /100 | #90 | Exceptional 11.6% |
| Spanish American Indians | 99.0 /100 | #91 | Exceptional 11.6% |
| Immigrants | Denmark | 98.9 /100 | #92 | Exceptional 11.6% |
| Arabs | 98.9 /100 | #93 | Exceptional 11.6% |
| Immigrants | Fiji | 98.9 /100 | #94 | Exceptional 11.6% |
| Immigrants | Serbia | 98.8 /100 | #95 | Exceptional 11.6% |
| Immigrants | Ukraine | 98.7 /100 | #96 | Exceptional 11.6% |
| Latvians | 98.7 /100 | #97 | Exceptional 11.6% |
| Immigrants | Jordan | 98.6 /100 | #98 | Exceptional 11.6% |
| Immigrants | Sweden | 98.6 /100 | #99 | Exceptional 11.6% |
| Immigrants | Northern Europe | 98.6 /100 | #100 | Exceptional 11.6% |
| Immigrants | Guyana | 98.5 /100 | #101 | Exceptional 11.6% |
| Immigrants | Croatia | 98.3 /100 | #102 | Exceptional 11.6% |
| Maltese | 98.2 /100 | #103 | Exceptional 11.6% |
| Salvadorans | 98.2 /100 | #104 | Exceptional 11.6% |
| Immigrants | El Salvador | 97.9 /100 | #105 | Exceptional 11.7% |
| Immigrants | Kazakhstan | 97.8 /100 | #106 | Exceptional 11.7% |
| Native Hawaiians | 97.2 /100 | #107 | Exceptional 11.7% |
| Greeks | 96.9 /100 | #108 | Exceptional 11.7% |